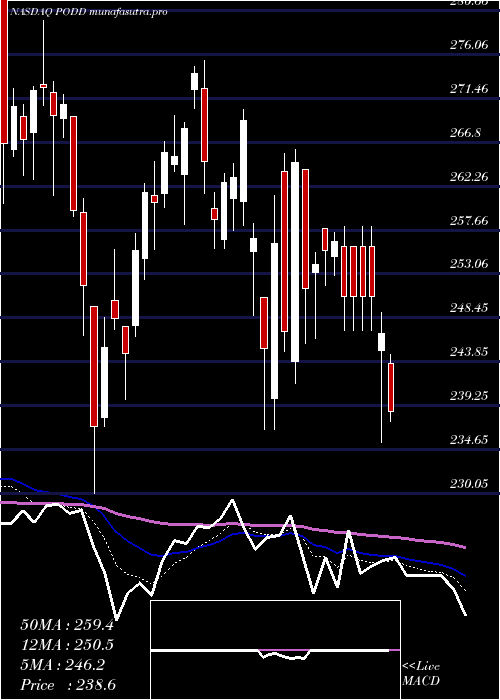
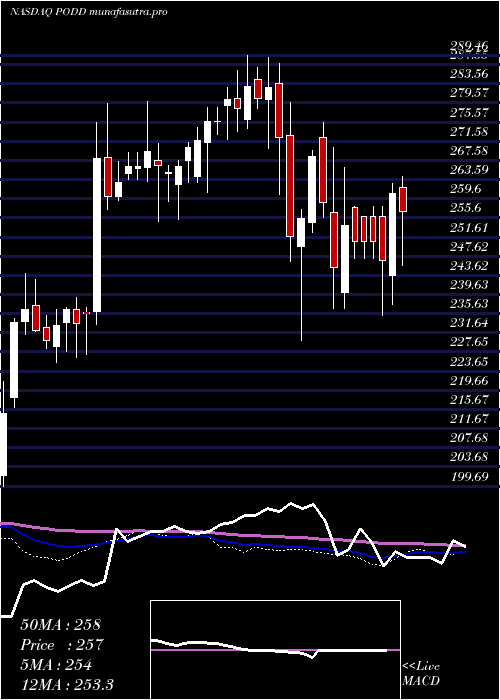
InsuletCorporation PODD full analysis,charts,indicators,moving averages,SMA,DMA,EMA,ADX,MACD,RSIInsulet Corporation PODD WideScreen charts, DMA,SMA,EMA technical analysis, forecast prediction, by indicators ADX,MACD,RSI,CCI NASDAQ stock exchange
operates under Health Care sector & deals in Medical Dental Instruments
Daily price and charts and targets InsuletCorporation Strong Daily Stock price targets for InsuletCorporation PODD are 297.21 and 310.24 | Daily Target 1 | 294.78 | | Daily Target 2 | 299.64 | | Daily Target 3 | 307.81333333333 | | Daily Target 4 | 312.67 | | Daily Target 5 | 320.84 |
Daily price and volume Insulet Corporation
| Date |
Closing |
Open |
Range |
Volume |
Fri 05 December 2025 |
304.49 (-3.62%) |
315.12 |
302.96 - 315.99 |
0.6347 times |
Thu 04 December 2025 |
315.92 (2.72%) |
308.78 |
305.05 - 317.34 |
0.9275 times |
Wed 03 December 2025 |
307.56 (-0.47%) |
309.18 |
303.20 - 310.44 |
1.109 times |
Tue 02 December 2025 |
309.00 (-0.59%) |
313.17 |
306.69 - 314.00 |
0.9305 times |
Mon 01 December 2025 |
310.83 (-5%) |
324.83 |
310.18 - 325.00 |
1.0766 times |
Fri 28 November 2025 |
327.19 (0.12%) |
327.95 |
324.28 - 328.28 |
0.2752 times |
Wed 26 November 2025 |
326.80 (-0.62%) |
327.54 |
324.00 - 330.83 |
0.8111 times |
Tue 25 November 2025 |
328.85 (-2.57%) |
337.53 |
325.55 - 342.13 |
1.0837 times |
Mon 24 November 2025 |
337.53 (1.92%) |
330.03 |
330.03 - 341.27 |
1.3837 times |
Fri 21 November 2025 |
331.17 (5.84%) |
321.96 |
316.88 - 334.47 |
1.7679 times |
Thu 20 November 2025 |
312.89 (-9.66%) |
347.25 |
312.06 - 354.88 |
2.2072 times |
Weekly price and charts InsuletCorporation Strong weekly Stock price targets for InsuletCorporation PODD are 292.71 and 314.75 | Weekly Target 1 | 288.78 | | Weekly Target 2 | 296.63 | | Weekly Target 3 | 310.81666666667 | | Weekly Target 4 | 318.67 | | Weekly Target 5 | 332.86 |
Weekly price and volumes for Insulet Corporation
| Date |
Closing |
Open |
Range |
Volume |
Fri 05 December 2025 |
304.49 (-6.94%) |
324.83 |
302.96 - 325.00 |
1.3715 times |
Fri 28 November 2025 |
327.19 (-1.2%) |
330.03 |
324.00 - 342.13 |
1.0418 times |
Fri 21 November 2025 |
331.17 (-0.46%) |
331.43 |
312.06 - 354.88 |
1.9359 times |
Fri 14 November 2025 |
332.70 (4.03%) |
320.63 |
311.51 - 341.03 |
0.9282 times |
Fri 07 November 2025 |
319.82 (2.18%) |
319.48 |
290.16 - 335.00 |
1.3056 times |
Fri 31 October 2025 |
313.01 (0%) |
310.81 |
309.27 - 316.67 |
0.1953 times |
Fri 31 October 2025 |
313.01 (-2.46%) |
321.40 |
309.27 - 326.81 |
0.7994 times |
Fri 24 October 2025 |
320.91 (0.73%) |
318.12 |
318.12 - 335.26 |
0.7485 times |
Fri 17 October 2025 |
318.59 (1.29%) |
314.43 |
312.05 - 323.69 |
0.7421 times |
Fri 10 October 2025 |
314.52 (1.75%) |
310.90 |
306.03 - 324.69 |
0.9316 times |
Fri 03 October 2025 |
309.12 (-2.79%) |
319.60 |
288.02 - 319.60 |
1.3342 times |
Monthly price and charts InsuletCorporation Strong monthly Stock price targets for InsuletCorporation PODD are 292.71 and 314.75 | Monthly Target 1 | 288.78 | | Monthly Target 2 | 296.63 | | Monthly Target 3 | 310.81666666667 | | Monthly Target 4 | 318.67 | | Monthly Target 5 | 332.86 |
Monthly price and volumes Insulet Corporation
| Date |
Closing |
Open |
Range |
Volume |
Fri 05 December 2025 |
304.49 (-6.94%) |
324.83 |
302.96 - 325.00 |
0.2715 times |
Fri 28 November 2025 |
327.19 (4.53%) |
319.48 |
290.16 - 354.88 |
1.0316 times |
Fri 31 October 2025 |
313.01 (1.39%) |
308.75 |
288.02 - 335.26 |
0.8223 times |
Tue 30 September 2025 |
308.73 (-9.16%) |
338.13 |
304.64 - 353.50 |
0.9813 times |
Fri 29 August 2025 |
339.88 (17.85%) |
286.25 |
276.46 - 341.14 |
1.0326 times |
Thu 31 July 2025 |
288.40 (-8.21%) |
310.54 |
280.43 - 313.54 |
0.8896 times |
Mon 30 June 2025 |
314.18 (-3.34%) |
324.23 |
295.56 - 325.61 |
1.1409 times |
Fri 30 May 2025 |
325.03 (28.83%) |
252.94 |
248.40 - 329.33 |
1.4447 times |
Wed 30 April 2025 |
252.29 (-3.93%) |
260.92 |
235.34 - 270.33 |
1.1684 times |
Mon 31 March 2025 |
262.61 (-3.55%) |
272.87 |
230.05 - 279.64 |
1.2172 times |
Fri 28 February 2025 |
272.27 (-2.19%) |
276.17 |
260.42 - 289.46 |
0.9794 times |

DMA SMA EMA moving averages of Insulet Corporation PODD
DMA (daily moving average) of Insulet Corporation PODD
| DMA period | DMA value | | 5 day DMA | 309.56 | | 12 day DMA | 321.55 | | 20 day DMA | 324.44 | | 35 day DMA | 322.83 | | 50 day DMA | 320.02 | | 100 day DMA | 319.13 | | 150 day DMA | 314.5 | | 200 day DMA | 300.65 | EMA (exponential moving average) of Insulet Corporation PODD
| EMA period | EMA current | EMA prev | EMA prev2 | | 5 day EMA | 311.54 | 315.07 | 314.65 | | 12 day EMA | 317.73 | 320.14 | 320.91 | | 20 day EMA | 320.25 | 321.91 | 322.54 | | 35 day EMA | 321.15 | 322.13 | 322.5 | | 50 day EMA | 319.69 | 320.31 | 320.49 |
SMA (simple moving average) of Insulet Corporation PODD
| SMA period | SMA current | SMA prev | SMA prev2 | | 5 day SMA | 309.56 | 314.1 | 316.28 | | 12 day SMA | 321.55 | 323.96 | 324.97 | | 20 day SMA | 324.44 | 325.38 | 325.31 | | 35 day SMA | 322.83 | 323.17 | 323.07 | | 50 day SMA | 320.02 | 320.4 | 320.62 | | 100 day SMA | 319.13 | 318.97 | 318.71 | | 150 day SMA | 314.5 | 314.14 | 313.71 | | 200 day SMA | 300.65 | 300.54 | 300.37 |
|
|
