PrimeenergyResources PNRG full analysis,charts,indicators,moving averages,SMA,DMA,EMA,ADX,MACD,RSIPrimeenergy Resources PNRG WideScreen charts, DMA,SMA,EMA technical analysis, forecast prediction, by indicators ADX,MACD,RSI,CCI NASDAQ stock exchange
operates under Energy sector & deals in Oil Gas Production
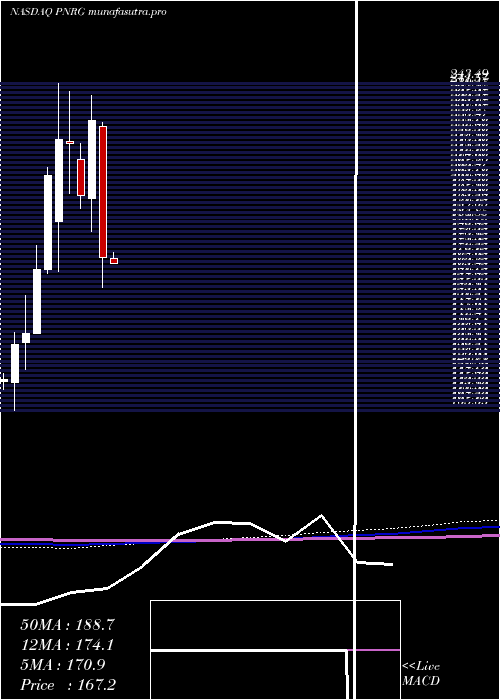
Daily price and charts and targets PrimeenergyResources Strong Daily Stock price targets for PrimeenergyResources PNRG are 156.16 and 161.6 | Daily Target 1 | 155.09 | | Daily Target 2 | 157.22 | | Daily Target 3 | 160.53 | | Daily Target 4 | 162.66 | | Daily Target 5 | 165.97 |
Daily price and volume Primeenergy Resources
| Date |
Closing |
Open |
Range |
Volume |
Tue 15 July 2025 |
159.35 (-1.87%) |
163.84 |
158.40 - 163.84 |
0.927 times |
Mon 14 July 2025 |
162.39 (-0.7%) |
163.19 |
158.02 - 163.53 |
0.9443 times |
Fri 11 July 2025 |
163.54 (-0.58%) |
165.44 |
159.29 - 165.44 |
0.3118 times |
Thu 10 July 2025 |
164.50 (2.86%) |
160.63 |
155.88 - 164.95 |
0.4771 times |
Wed 09 July 2025 |
159.93 (-3.35%) |
164.62 |
159.70 - 166.27 |
1.0455 times |
Tue 08 July 2025 |
165.47 (12.98%) |
147.45 |
146.50 - 166.82 |
1.0981 times |
Mon 07 July 2025 |
146.46 (-6.65%) |
155.00 |
144.23 - 156.49 |
1.8894 times |
Thu 03 July 2025 |
156.89 (3.36%) |
153.27 |
152.21 - 157.86 |
0.4187 times |
Wed 02 July 2025 |
151.79 (1.22%) |
151.66 |
143.10 - 153.46 |
1.7981 times |
Tue 01 July 2025 |
149.96 (2.45%) |
145.02 |
144.90 - 153.53 |
1.0899 times |
Mon 30 June 2025 |
146.38 (-3.51%) |
151.56 |
145.94 - 153.43 |
1.5867 times |
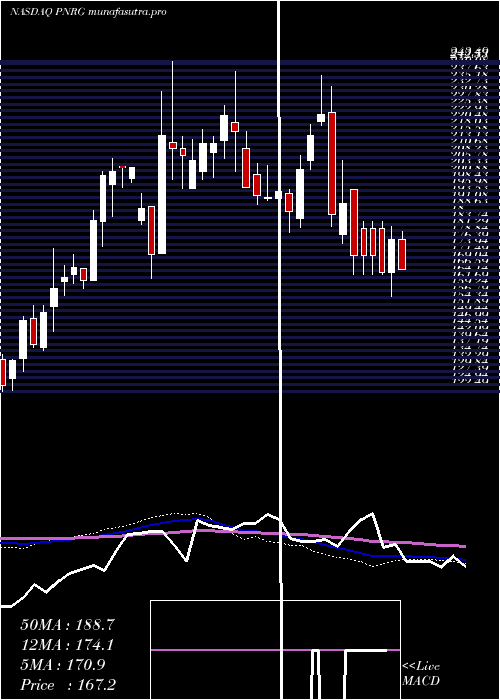
Weekly price and charts PrimeenergyResources Strong weekly Stock price targets for PrimeenergyResources PNRG are 155.78 and 161.6 | Weekly Target 1 | 154.58 | | Weekly Target 2 | 156.97 | | Weekly Target 3 | 160.40333333333 | | Weekly Target 4 | 162.79 | | Weekly Target 5 | 166.22 |
Weekly price and volumes for Primeenergy Resources
| Date |
Closing |
Open |
Range |
Volume |
Tue 15 July 2025 |
159.35 (-2.56%) |
163.19 |
158.02 - 163.84 |
0.4606 times |
Fri 11 July 2025 |
163.54 (4.24%) |
155.00 |
144.23 - 166.82 |
1.1868 times |
Thu 03 July 2025 |
156.89 (3.42%) |
151.56 |
143.10 - 157.86 |
1.2044 times |
Fri 27 June 2025 |
151.70 (-1.05%) |
153.35 |
143.84 - 154.99 |
1.3449 times |
Fri 20 June 2025 |
153.31 (4.82%) |
145.35 |
145.35 - 154.20 |
0.7612 times |
Fri 13 June 2025 |
146.26 (1.57%) |
142.93 |
141.50 - 154.84 |
1.4972 times |
Fri 06 June 2025 |
144.00 (-25.43%) |
195.40 |
138.18 - 195.99 |
1.731 times |
Fri 30 May 2025 |
193.10 (0.59%) |
192.00 |
188.30 - 201.00 |
1.1783 times |
Fri 23 May 2025 |
191.97 (3.48%) |
183.70 |
180.82 - 192.49 |
0.4661 times |
Fri 16 May 2025 |
185.51 (9.32%) |
178.96 |
175.04 - 186.59 |
0.1695 times |
Fri 09 May 2025 |
169.69 (1.51%) |
165.80 |
159.73 - 174.01 |
0.1172 times |
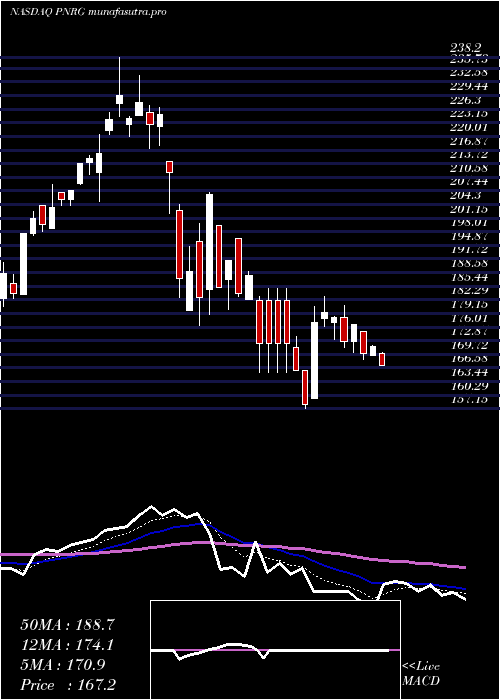
Monthly price and charts PrimeenergyResources Strong monthly Stock price targets for PrimeenergyResources PNRG are 151.23 and 174.95 | Monthly Target 1 | 132.7 | | Monthly Target 2 | 146.03 | | Monthly Target 3 | 156.42333333333 | | Monthly Target 4 | 169.75 | | Monthly Target 5 | 180.14 |
Monthly price and volumes Primeenergy Resources
| Date |
Closing |
Open |
Range |
Volume |
Tue 15 July 2025 |
159.35 (8.86%) |
145.02 |
143.10 - 166.82 |
1.7791 times |
Mon 30 June 2025 |
146.38 (-24.19%) |
195.40 |
138.18 - 195.99 |
4.1381 times |
Fri 30 May 2025 |
193.10 (13.68%) |
169.54 |
159.73 - 201.00 |
1.4164 times |
Wed 30 April 2025 |
169.87 (-25.46%) |
225.44 |
157.15 - 227.11 |
0.511 times |
Mon 31 March 2025 |
227.89 (16.33%) |
194.94 |
180.81 - 238.20 |
0.4574 times |
Fri 28 February 2025 |
195.90 (-10.1%) |
211.50 |
190.70 - 217.86 |
0.3855 times |
Fri 31 January 2025 |
217.90 (-0.77%) |
218.75 |
196.96 - 239.87 |
0.664 times |
Tue 31 December 2024 |
219.59 (7.33%) |
184.97 |
163.77 - 243.49 |
0.2785 times |
Tue 26 November 2024 |
204.59 (24.03%) |
164.70 |
162.95 - 207.80 |
0.1604 times |
Thu 31 October 2024 |
164.95 (19.7%) |
137.80 |
137.78 - 174.98 |
0.2096 times |
Mon 30 September 2024 |
137.80 (3.59%) |
133.98 |
122.49 - 153.83 |
0.2447 times |
DMA SMA EMA moving averages of Primeenergy Resources PNRG
DMA (daily moving average) of Primeenergy Resources PNRG
| DMA period | DMA value | | 5 day DMA | 161.94 | | 12 day DMA | 156.53 | | 20 day DMA | 153.59 | | 35 day DMA | 161.27 | | 50 day DMA | 165.67 | | 100 day DMA | 179.75 | | 150 day DMA | 188.04 | | 200 day DMA | 182.82 | EMA (exponential moving average) of Primeenergy Resources PNRG
| EMA period | EMA current | EMA prev | EMA prev2 | | 5 day EMA | 160.68 | 161.34 | 160.82 | | 12 day EMA | 158.15 | 157.93 | 157.12 | | 20 day EMA | 157.75 | 157.58 | 157.07 | | 35 day EMA | 161.2 | 161.31 | 161.25 | | 50 day EMA | 166.08 | 166.35 | 166.51 |
SMA (simple moving average) of Primeenergy Resources PNRG
| SMA period | SMA current | SMA prev | SMA prev2 | | 5 day SMA | 161.94 | 163.17 | 159.98 | | 12 day SMA | 156.53 | 156.01 | 154.56 | | 20 day SMA | 153.59 | 152.76 | 152.19 | | 35 day SMA | 161.27 | 162.06 | 162.8 | | 50 day SMA | 165.67 | 165.88 | 166.16 | | 100 day SMA | 179.75 | 180.2 | 180.52 | | 150 day SMA | 188.04 | 188.34 | 188.62 | | 200 day SMA | 182.82 | 182.7 | 182.55 |
|
|
