PulseBiosciences PLSE full analysis,charts,indicators,moving averages,SMA,DMA,EMA,ADX,MACD,RSIPulse Biosciences PLSE WideScreen charts, DMA,SMA,EMA technical analysis, forecast prediction, by indicators ADX,MACD,RSI,CCI NASDAQ stock exchange
operates under Health Care sector & deals in Medical Dental Instruments
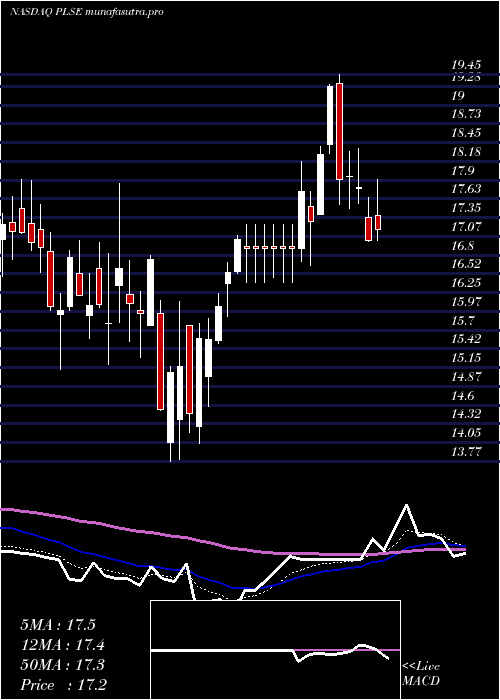
Daily price and charts and targets PulseBiosciences Strong Daily Stock price targets for PulseBiosciences PLSE are 14.6 and 15.72 | Daily Target 1 | 14.39 | | Daily Target 2 | 14.8 | | Daily Target 3 | 15.506666666667 | | Daily Target 4 | 15.92 | | Daily Target 5 | 16.63 |
Daily price and volume Pulse Biosciences
| Date |
Closing |
Open |
Range |
Volume |
Tue 15 July 2025 |
15.22 (-5.29%) |
16.15 |
15.09 - 16.21 |
0.7863 times |
Mon 14 July 2025 |
16.07 (0.25%) |
15.96 |
15.50 - 16.18 |
0.818 times |
Fri 11 July 2025 |
16.03 (-6.37%) |
17.00 |
15.77 - 17.00 |
0.6124 times |
Thu 10 July 2025 |
17.12 (5.74%) |
16.14 |
15.97 - 17.27 |
0.7616 times |
Wed 09 July 2025 |
16.19 (4.25%) |
15.64 |
15.19 - 16.68 |
1.4151 times |
Tue 08 July 2025 |
15.53 (-1.77%) |
15.83 |
15.26 - 15.94 |
0.9998 times |
Mon 07 July 2025 |
15.81 (3.33%) |
15.30 |
15.22 - 16.30 |
1.4198 times |
Thu 03 July 2025 |
15.30 (-0.13%) |
15.29 |
15.01 - 15.42 |
0.5223 times |
Wed 02 July 2025 |
15.32 (3.23%) |
14.82 |
14.68 - 15.42 |
1.151 times |
Tue 01 July 2025 |
14.84 (-1.66%) |
14.96 |
14.69 - 15.33 |
1.5137 times |
Mon 30 June 2025 |
15.09 (0.07%) |
15.20 |
14.99 - 15.40 |
0.6952 times |
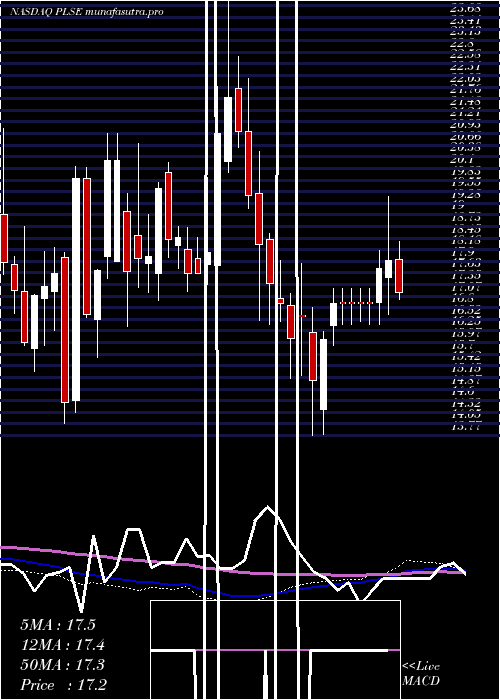
Weekly price and charts PulseBiosciences Strong weekly Stock price targets for PulseBiosciences PLSE are 14.6 and 15.72 | Weekly Target 1 | 14.39 | | Weekly Target 2 | 14.8 | | Weekly Target 3 | 15.506666666667 | | Weekly Target 4 | 15.92 | | Weekly Target 5 | 16.63 |
Weekly price and volumes for Pulse Biosciences
| Date |
Closing |
Open |
Range |
Volume |
Tue 15 July 2025 |
15.22 (-5.05%) |
15.96 |
15.09 - 16.21 |
0.3954 times |
Fri 11 July 2025 |
16.03 (4.77%) |
15.30 |
15.19 - 17.27 |
1.2836 times |
Thu 03 July 2025 |
15.30 (1.46%) |
15.20 |
14.68 - 15.42 |
0.9567 times |
Fri 27 June 2025 |
15.08 (-1.44%) |
15.21 |
14.65 - 15.61 |
1.1381 times |
Fri 20 June 2025 |
15.30 (-2.98%) |
15.03 |
14.57 - 15.44 |
1.0584 times |
Fri 13 June 2025 |
15.77 (-7.78%) |
17.33 |
15.76 - 17.81 |
1.3092 times |
Fri 06 June 2025 |
17.10 (-1.21%) |
17.27 |
15.92 - 17.91 |
0.9925 times |
Fri 30 May 2025 |
17.31 (2.49%) |
17.01 |
16.75 - 18.26 |
0.7579 times |
Fri 23 May 2025 |
16.89 (-1.75%) |
16.88 |
16.45 - 18.10 |
1.0131 times |
Fri 16 May 2025 |
17.19 (0.7%) |
17.78 |
15.72 - 17.89 |
1.0952 times |
Fri 09 May 2025 |
17.07 (-0.7%) |
17.00 |
15.92 - 17.54 |
1.0879 times |
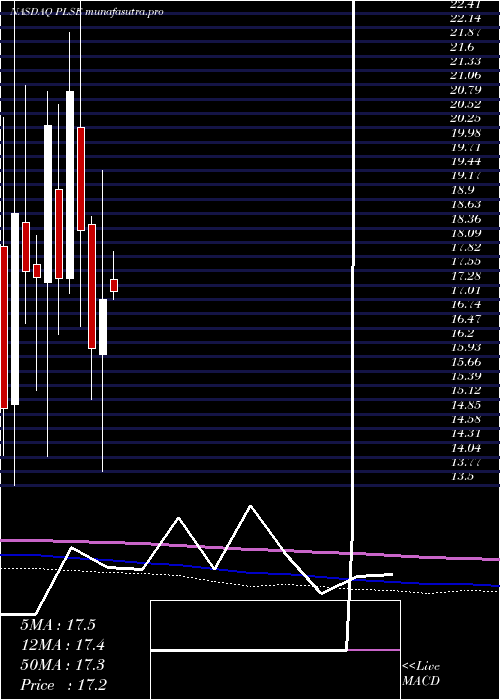
Monthly price and charts PulseBiosciences Strong monthly Stock price targets for PulseBiosciences PLSE are 14.95 and 17.54 | Monthly Target 1 | 13.13 | | Monthly Target 2 | 14.18 | | Monthly Target 3 | 15.723333333333 | | Monthly Target 4 | 16.77 | | Monthly Target 5 | 18.31 |
Monthly price and volumes Pulse Biosciences
| Date |
Closing |
Open |
Range |
Volume |
Tue 15 July 2025 |
15.22 (0.86%) |
14.96 |
14.68 - 17.27 |
0.5853 times |
Mon 30 June 2025 |
15.09 (-12.82%) |
17.27 |
14.57 - 17.91 |
1.1091 times |
Fri 30 May 2025 |
17.31 (1.7%) |
17.38 |
15.72 - 18.26 |
1.0591 times |
Wed 30 April 2025 |
17.02 (5.78%) |
15.98 |
13.77 - 19.45 |
1.1026 times |
Mon 31 March 2025 |
16.09 (-12.12%) |
18.42 |
15.12 - 18.57 |
1.227 times |
Fri 28 February 2025 |
18.31 (-12.52%) |
20.26 |
16.50 - 25.00 |
0.9942 times |
Fri 31 January 2025 |
20.93 (20.22%) |
17.41 |
17.12 - 22.05 |
0.8667 times |
Tue 31 December 2024 |
17.41 (-14.24%) |
19.08 |
16.35 - 20.69 |
0.8885 times |
Tue 26 November 2024 |
20.30 (16.47%) |
17.33 |
14.06 - 20.94 |
1.3475 times |
Thu 31 October 2024 |
17.43 (-0.63%) |
17.68 |
15.29 - 18.22 |
0.8199 times |
Mon 30 September 2024 |
17.54 (-5.9%) |
18.46 |
16.55 - 21.05 |
1.0159 times |
DMA SMA EMA moving averages of Pulse Biosciences PLSE
DMA (daily moving average) of Pulse Biosciences PLSE
| DMA period | DMA value | | 5 day DMA | 16.13 | | 12 day DMA | 15.63 | | 20 day DMA | 15.49 | | 35 day DMA | 16.19 | | 50 day DMA | 16.4 | | 100 day DMA | 16.69 | | 150 day DMA | 17.52 | | 200 day DMA | 17.44 | EMA (exponential moving average) of Pulse Biosciences PLSE
| EMA period | EMA current | EMA prev | EMA prev2 | | 5 day EMA | 15.81 | 16.1 | 16.12 | | 12 day EMA | 15.78 | 15.88 | 15.84 | | 20 day EMA | 15.84 | 15.91 | 15.89 | | 35 day EMA | 16.08 | 16.13 | 16.13 | | 50 day EMA | 16.49 | 16.54 | 16.56 |
SMA (simple moving average) of Pulse Biosciences PLSE
| SMA period | SMA current | SMA prev | SMA prev2 | | 5 day SMA | 16.13 | 16.19 | 16.14 | | 12 day SMA | 15.63 | 15.61 | 15.54 | | 20 day SMA | 15.49 | 15.54 | 15.57 | | 35 day SMA | 16.19 | 16.25 | 16.28 | | 50 day SMA | 16.4 | 16.43 | 16.47 | | 100 day SMA | 16.69 | 16.74 | 16.78 | | 150 day SMA | 17.52 | 17.55 | 17.57 | | 200 day SMA | 17.44 | 17.46 | 17.47 |
|
|
