InvescoWater PHO full analysis,charts,indicators,moving averages,SMA,DMA,EMA,ADX,MACD,RSIInvesco Water PHO WideScreen charts, DMA,SMA,EMA technical analysis, forecast prediction, by indicators ADX,MACD,RSI,CCI NASDAQ stock exchange
operates under N A sector & deals in N A
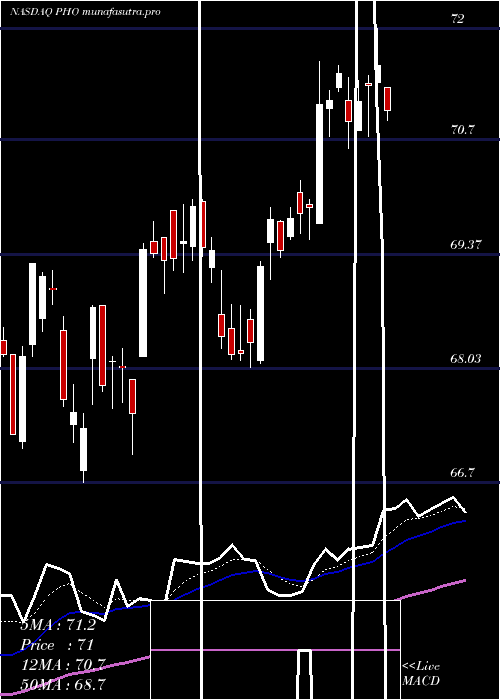
Daily price and charts and targets InvescoWater Strong Daily Stock price targets for InvescoWater PHO are 71.63 and 72.12 | Daily Target 1 | 71.53 | | Daily Target 2 | 71.73 | | Daily Target 3 | 72.016666666667 | | Daily Target 4 | 72.22 | | Daily Target 5 | 72.51 |
Daily price and volume Invesco Water
| Date |
Closing |
Open |
Range |
Volume |
Fri 05 December 2025 |
71.94 (-0.37%) |
72.12 |
71.81 - 72.30 |
0.8146 times |
Thu 04 December 2025 |
72.21 (-0.3%) |
72.32 |
72.00 - 72.50 |
1.1802 times |
Wed 03 December 2025 |
72.43 (0.49%) |
72.14 |
72.14 - 72.55 |
0.3841 times |
Tue 02 December 2025 |
72.08 (0.07%) |
72.14 |
71.93 - 72.37 |
0.8666 times |
Mon 01 December 2025 |
72.03 (-0.5%) |
71.86 |
71.79 - 72.60 |
2.3103 times |
Fri 28 November 2025 |
72.39 (-0.34%) |
72.72 |
72.36 - 72.80 |
0.8258 times |
Wed 26 November 2025 |
72.64 (0.26%) |
72.42 |
72.41 - 72.93 |
1.2173 times |
Tue 25 November 2025 |
72.45 (2.11%) |
71.06 |
71.06 - 72.63 |
0.8128 times |
Mon 24 November 2025 |
70.95 (0.16%) |
70.88 |
70.56 - 71.30 |
0.7256 times |
Fri 21 November 2025 |
70.84 (2.4%) |
69.26 |
69.26 - 71.21 |
0.8629 times |
Thu 20 November 2025 |
69.18 (-0.85%) |
70.24 |
69.12 - 70.84 |
0.8759 times |
Weekly price and charts InvescoWater Strong weekly Stock price targets for InvescoWater PHO are 71.87 and 72.68 | Weekly Target 1 | 71.3 | | Weekly Target 2 | 71.62 | | Weekly Target 3 | 72.11 | | Weekly Target 4 | 72.43 | | Weekly Target 5 | 72.92 |
Weekly price and volumes for Invesco Water
| Date |
Closing |
Open |
Range |
Volume |
Fri 05 December 2025 |
71.94 (-0.62%) |
71.86 |
71.79 - 72.60 |
0.8268 times |
Fri 28 November 2025 |
72.39 (2.19%) |
70.88 |
70.56 - 72.93 |
0.533 times |
Fri 21 November 2025 |
70.84 (-0.92%) |
71.32 |
69.12 - 71.43 |
0.7092 times |
Fri 14 November 2025 |
71.50 (-0.8%) |
72.63 |
71.43 - 73.17 |
0.6907 times |
Fri 07 November 2025 |
72.08 (0.9%) |
70.72 |
70.72 - 72.84 |
0.7131 times |
Fri 31 October 2025 |
71.44 (0%) |
71.36 |
71.03 - 71.63 |
0.1428 times |
Fri 31 October 2025 |
71.44 (-4.03%) |
74.78 |
71.03 - 74.78 |
1.346 times |
Fri 24 October 2025 |
74.44 (1.78%) |
73.32 |
73.17 - 74.93 |
0.8843 times |
Fri 17 October 2025 |
73.14 (1.92%) |
72.01 |
71.52 - 73.65 |
3.1897 times |
Fri 10 October 2025 |
71.76 (-1.83%) |
73.14 |
71.71 - 73.61 |
0.9644 times |
Fri 03 October 2025 |
73.10 (2.48%) |
71.68 |
71.18 - 73.45 |
0.5809 times |

Monthly price and charts InvescoWater Strong monthly Stock price targets for InvescoWater PHO are 71.87 and 72.68 | Monthly Target 1 | 71.3 | | Monthly Target 2 | 71.62 | | Monthly Target 3 | 72.11 | | Monthly Target 4 | 72.43 | | Monthly Target 5 | 72.92 |
Monthly price and volumes Invesco Water
| Date |
Closing |
Open |
Range |
Volume |
Fri 05 December 2025 |
71.94 (-0.62%) |
71.86 |
71.79 - 72.60 |
0.2793 times |
Fri 28 November 2025 |
72.39 (1.33%) |
70.72 |
69.12 - 73.17 |
0.8937 times |
Fri 31 October 2025 |
71.44 (-0.93%) |
71.89 |
71.03 - 74.93 |
2.3152 times |
Tue 30 September 2025 |
72.11 (-1.04%) |
72.24 |
70.27 - 74.04 |
0.8894 times |
Fri 29 August 2025 |
72.87 (3.42%) |
70.02 |
69.36 - 74.33 |
0.7254 times |
Thu 31 July 2025 |
70.46 (0.79%) |
69.72 |
69.00 - 72.00 |
0.7611 times |
Mon 30 June 2025 |
69.91 (2.73%) |
67.91 |
67.03 - 70.23 |
0.7771 times |
Fri 30 May 2025 |
68.05 (4.16%) |
65.49 |
64.96 - 69.26 |
1.0312 times |
Wed 30 April 2025 |
65.33 (1.26%) |
64.45 |
57.11 - 65.49 |
1.164 times |
Mon 31 March 2025 |
64.52 (-4.03%) |
67.43 |
63.46 - 67.71 |
1.1637 times |
Fri 28 February 2025 |
67.23 (-1.74%) |
67.40 |
66.00 - 68.26 |
1.4025 times |

DMA SMA EMA moving averages of Invesco Water PHO
DMA (daily moving average) of Invesco Water PHO
| DMA period | DMA value | | 5 day DMA | 72.14 | | 12 day DMA | 71.58 | | 20 day DMA | 71.63 | | 35 day DMA | 72.16 | | 50 day DMA | 72.28 | | 100 day DMA | 72.06 | | 150 day DMA | 71.01 | | 200 day DMA | 69.29 | EMA (exponential moving average) of Invesco Water PHO
| EMA period | EMA current | EMA prev | EMA prev2 | | 5 day EMA | 72.09 | 72.16 | 72.14 | | 12 day EMA | 71.9 | 71.89 | 71.83 | | 20 day EMA | 71.86 | 71.85 | 71.81 | | 35 day EMA | 71.96 | 71.96 | 71.95 | | 50 day EMA | 72.18 | 72.19 | 72.19 |
SMA (simple moving average) of Invesco Water PHO
| SMA period | SMA current | SMA prev | SMA prev2 | | 5 day SMA | 72.14 | 72.23 | 72.31 | | 12 day SMA | 71.58 | 71.43 | 71.28 | | 20 day SMA | 71.63 | 71.61 | 71.61 | | 35 day SMA | 72.16 | 72.19 | 72.21 | | 50 day SMA | 72.28 | 72.25 | 72.22 | | 100 day SMA | 72.06 | 72.04 | 72.02 | | 150 day SMA | 71.01 | 70.97 | 70.92 | | 200 day SMA | 69.29 | 69.27 | 69.25 |
|
|
