PeapackGladstone PGC full analysis,charts,indicators,moving averages,SMA,DMA,EMA,ADX,MACD,RSIPeapack Gladstone PGC WideScreen charts, DMA,SMA,EMA technical analysis, forecast prediction, by indicators ADX,MACD,RSI,CCI NASDAQ stock exchange
operates under Finance sector & deals in Commercial Banks
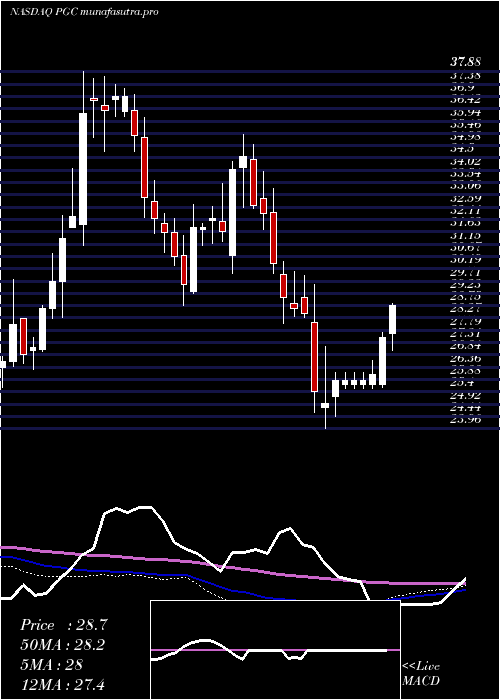
Daily price and charts and targets PeapackGladstone Strong Daily Stock price targets for PeapackGladstone PGC are 27.63 and 28.13 | Daily Target 1 | 27.52 | | Daily Target 2 | 27.74 | | Daily Target 3 | 28.02 | | Daily Target 4 | 28.24 | | Daily Target 5 | 28.52 |
Daily price and volume Peapack Gladstone
| Date |
Closing |
Open |
Range |
Volume |
Fri 05 December 2025 |
27.96 (-0.57%) |
28.12 |
27.80 - 28.30 |
0.3753 times |
Thu 04 December 2025 |
28.12 (-0.11%) |
28.03 |
27.91 - 28.34 |
0.4556 times |
Wed 03 December 2025 |
28.15 (2.62%) |
27.57 |
27.19 - 28.23 |
0.3915 times |
Tue 02 December 2025 |
27.43 (1.03%) |
27.18 |
27.07 - 27.66 |
0.5654 times |
Mon 01 December 2025 |
27.15 (0.56%) |
26.65 |
26.36 - 27.38 |
0.7171 times |
Fri 28 November 2025 |
27.00 (0.19%) |
27.00 |
26.76 - 27.21 |
0.363 times |
Wed 26 November 2025 |
26.95 (-0.74%) |
26.97 |
26.74 - 27.09 |
0.6446 times |
Tue 25 November 2025 |
27.15 (4.02%) |
26.11 |
26.11 - 27.37 |
1.4549 times |
Mon 24 November 2025 |
26.10 (0.97%) |
25.85 |
25.26 - 26.18 |
1.156 times |
Fri 21 November 2025 |
25.85 (3.11%) |
25.19 |
25.19 - 26.15 |
3.8767 times |
Thu 20 November 2025 |
25.07 (-0.91%) |
25.66 |
24.97 - 25.99 |
0.6814 times |

Weekly price and charts PeapackGladstone Strong weekly Stock price targets for PeapackGladstone PGC are 27.16 and 29.14 | Weekly Target 1 | 25.57 | | Weekly Target 2 | 26.77 | | Weekly Target 3 | 27.553333333333 | | Weekly Target 4 | 28.75 | | Weekly Target 5 | 29.53 |
Weekly price and volumes for Peapack Gladstone
| Date |
Closing |
Open |
Range |
Volume |
Fri 05 December 2025 |
27.96 (3.56%) |
26.65 |
26.36 - 28.34 |
0.6451 times |
Fri 28 November 2025 |
27.00 (4.45%) |
25.85 |
25.26 - 27.37 |
0.9319 times |
Fri 21 November 2025 |
25.85 (-0.58%) |
26.08 |
24.75 - 26.79 |
1.9342 times |
Fri 14 November 2025 |
26.00 (1.21%) |
25.85 |
24.88 - 26.61 |
1.6612 times |
Fri 07 November 2025 |
25.69 (1.54%) |
24.88 |
24.71 - 25.87 |
0.5915 times |
Fri 31 October 2025 |
25.30 (0%) |
25.25 |
25.08 - 25.49 |
0.1096 times |
Fri 31 October 2025 |
25.30 (-7.53%) |
27.33 |
25.08 - 27.47 |
0.6728 times |
Fri 24 October 2025 |
27.36 (3.91%) |
26.51 |
25.62 - 28.22 |
0.995 times |
Fri 17 October 2025 |
26.33 (-2.91%) |
27.49 |
26.15 - 28.77 |
1.7311 times |
Fri 10 October 2025 |
27.12 (-1.95%) |
27.98 |
27.04 - 28.47 |
0.7275 times |
Fri 03 October 2025 |
27.66 (-1.71%) |
28.22 |
26.79 - 28.22 |
0.5458 times |
Monthly price and charts PeapackGladstone Strong monthly Stock price targets for PeapackGladstone PGC are 27.16 and 29.14 | Monthly Target 1 | 25.57 | | Monthly Target 2 | 26.77 | | Monthly Target 3 | 27.553333333333 | | Monthly Target 4 | 28.75 | | Monthly Target 5 | 29.53 |
Monthly price and volumes Peapack Gladstone
| Date |
Closing |
Open |
Range |
Volume |
Fri 05 December 2025 |
27.96 (3.56%) |
26.65 |
26.36 - 28.34 |
0.2081 times |
Fri 28 November 2025 |
27.00 (6.72%) |
24.88 |
24.71 - 27.37 |
1.6511 times |
Fri 31 October 2025 |
25.30 (-8.33%) |
27.32 |
25.08 - 28.77 |
1.4592 times |
Tue 30 September 2025 |
27.60 (-4.86%) |
28.64 |
27.31 - 30.05 |
1.0851 times |
Fri 29 August 2025 |
29.01 (13.85%) |
25.18 |
24.42 - 29.13 |
0.9533 times |
Thu 31 July 2025 |
25.48 (-9.81%) |
27.98 |
25.34 - 30.77 |
1.1206 times |
Mon 30 June 2025 |
28.25 (3.03%) |
27.37 |
26.30 - 28.56 |
0.683 times |
Fri 30 May 2025 |
27.42 (-0.94%) |
27.30 |
26.26 - 29.86 |
0.8173 times |
Wed 30 April 2025 |
27.68 (-2.54%) |
28.14 |
23.96 - 29.58 |
1.117 times |
Mon 31 March 2025 |
28.40 (-12.24%) |
32.39 |
27.85 - 33.30 |
0.9053 times |
Fri 28 February 2025 |
32.36 (2.24%) |
30.69 |
30.01 - 35.41 |
0.7075 times |
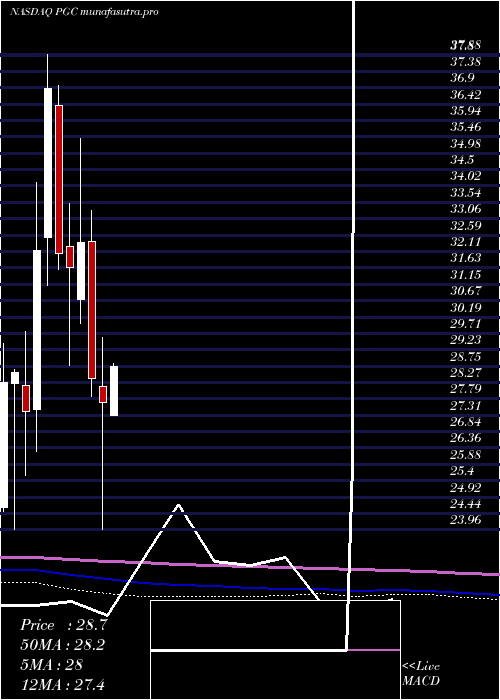
DMA SMA EMA moving averages of Peapack Gladstone PGC
DMA (daily moving average) of Peapack Gladstone PGC
| DMA period | DMA value | | 5 day DMA | 27.76 | | 12 day DMA | 26.85 | | 20 day DMA | 26.39 | | 35 day DMA | 26.34 | | 50 day DMA | 26.73 | | 100 day DMA | 27.24 | | 150 day DMA | 27.61 | | 200 day DMA | 27.78 | EMA (exponential moving average) of Peapack Gladstone PGC
| EMA period | EMA current | EMA prev | EMA prev2 | | 5 day EMA | 27.74 | 27.63 | 27.39 | | 12 day EMA | 27.13 | 26.98 | 26.77 | | 20 day EMA | 26.8 | 26.68 | 26.53 | | 35 day EMA | 26.85 | 26.78 | 26.7 | | 50 day EMA | 26.99 | 26.95 | 26.9 |
SMA (simple moving average) of Peapack Gladstone PGC
| SMA period | SMA current | SMA prev | SMA prev2 | | 5 day SMA | 27.76 | 27.57 | 27.34 | | 12 day SMA | 26.85 | 26.64 | 26.37 | | 20 day SMA | 26.39 | 26.26 | 26.14 | | 35 day SMA | 26.34 | 26.29 | 26.31 | | 50 day SMA | 26.73 | 26.73 | 26.74 | | 100 day SMA | 27.24 | 27.25 | 27.26 | | 150 day SMA | 27.61 | 27.61 | 27.61 | | 200 day SMA | 27.78 | 27.81 | 27.84 |
|
|
