PeoplesBancorp PEBO full analysis,charts,indicators,moving averages,SMA,DMA,EMA,ADX,MACD,RSIPeoples Bancorp PEBO WideScreen charts, DMA,SMA,EMA technical analysis, forecast prediction, by indicators ADX,MACD,RSI,CCI NASDAQ stock exchange
operates under Finance sector & deals in Major Banks
Daily price and charts and targets PeoplesBancorp Strong Daily Stock price targets for PeoplesBancorp PEBO are 31.21 and 31.57 | Daily Target 1 | 31.14 | | Daily Target 2 | 31.28 | | Daily Target 3 | 31.503333333333 | | Daily Target 4 | 31.64 | | Daily Target 5 | 31.86 |
Daily price and volume Peoples Bancorp
| Date |
Closing |
Open |
Range |
Volume |
Fri 11 July 2025 |
31.41 (-1.44%) |
31.65 |
31.37 - 31.73 |
0.628 times |
Thu 10 July 2025 |
31.87 (0.06%) |
31.74 |
31.50 - 32.14 |
1.0458 times |
Wed 09 July 2025 |
31.85 (-0.22%) |
32.07 |
31.63 - 32.14 |
0.851 times |
Tue 08 July 2025 |
31.92 (0.5%) |
31.76 |
31.64 - 32.20 |
1.0263 times |
Mon 07 July 2025 |
31.76 (-1.06%) |
31.90 |
31.64 - 32.23 |
1.2877 times |
Thu 03 July 2025 |
32.10 (0.78%) |
32.07 |
31.25 - 32.30 |
0.9474 times |
Wed 02 July 2025 |
31.85 (1.11%) |
31.67 |
31.13 - 31.90 |
0.6362 times |
Tue 01 July 2025 |
31.50 (3.14%) |
30.37 |
30.37 - 31.75 |
0.9012 times |
Mon 30 June 2025 |
30.54 (-0.1%) |
30.76 |
30.51 - 30.88 |
0.7531 times |
Fri 27 June 2025 |
30.57 (0.03%) |
30.65 |
30.41 - 30.81 |
1.9234 times |
Thu 26 June 2025 |
30.56 (2.55%) |
29.94 |
29.90 - 30.59 |
0.5342 times |
Weekly price and charts PeoplesBancorp Strong weekly Stock price targets for PeoplesBancorp PEBO are 30.96 and 31.82 | Weekly Target 1 | 30.81 | | Weekly Target 2 | 31.11 | | Weekly Target 3 | 31.67 | | Weekly Target 4 | 31.97 | | Weekly Target 5 | 32.53 |
Weekly price and volumes for Peoples Bancorp
| Date |
Closing |
Open |
Range |
Volume |
Fri 11 July 2025 |
31.41 (-2.15%) |
31.90 |
31.37 - 32.23 |
1.3906 times |
Thu 03 July 2025 |
32.10 (5%) |
30.76 |
30.37 - 32.30 |
0.9305 times |
Fri 27 June 2025 |
30.57 (5.45%) |
28.85 |
28.85 - 30.81 |
2.0111 times |
Fri 20 June 2025 |
28.99 (-0.62%) |
28.91 |
28.72 - 29.31 |
0.7278 times |
Fri 13 June 2025 |
29.17 (-1.32%) |
29.59 |
29.08 - 30.38 |
0.7957 times |
Fri 06 June 2025 |
29.56 (0.82%) |
29.33 |
28.84 - 29.79 |
0.7841 times |
Fri 30 May 2025 |
29.32 (0.21%) |
29.62 |
29.23 - 29.85 |
0.603 times |
Fri 23 May 2025 |
29.26 (-5.06%) |
30.75 |
29.00 - 30.98 |
0.8274 times |
Fri 16 May 2025 |
30.82 (4.02%) |
30.35 |
30.29 - 31.06 |
1.0651 times |
Fri 09 May 2025 |
29.63 (-0.7%) |
29.35 |
28.82 - 29.80 |
0.8648 times |
Fri 02 May 2025 |
29.84 (4.19%) |
28.61 |
28.59 - 29.96 |
1.1179 times |

Monthly price and charts PeoplesBancorp Strong monthly Stock price targets for PeoplesBancorp PEBO are 30.89 and 32.82 | Monthly Target 1 | 29.43 | | Monthly Target 2 | 30.42 | | Monthly Target 3 | 31.36 | | Monthly Target 4 | 32.35 | | Monthly Target 5 | 33.29 |
Monthly price and volumes Peoples Bancorp
| Date |
Closing |
Open |
Range |
Volume |
Fri 11 July 2025 |
31.41 (2.85%) |
30.37 |
30.37 - 32.30 |
0.5441 times |
Mon 30 June 2025 |
30.54 (4.16%) |
29.33 |
28.72 - 30.88 |
1.1723 times |
Fri 30 May 2025 |
29.32 (1.07%) |
28.98 |
28.65 - 31.06 |
0.9979 times |
Wed 30 April 2025 |
29.01 (-2.19%) |
29.53 |
26.21 - 29.86 |
1.2236 times |
Mon 31 March 2025 |
29.66 (-7.31%) |
32.14 |
29.00 - 32.75 |
1.0876 times |
Fri 28 February 2025 |
32.00 (-1.99%) |
31.64 |
31.25 - 33.83 |
0.9278 times |
Fri 31 January 2025 |
32.65 (3.03%) |
32.01 |
29.75 - 33.58 |
1.1918 times |
Tue 31 December 2024 |
31.69 (-10.33%) |
34.94 |
31.39 - 35.32 |
0.7115 times |
Tue 26 November 2024 |
35.34 (14.81%) |
30.90 |
29.81 - 37.07 |
1.1207 times |
Thu 31 October 2024 |
30.78 (2.29%) |
30.05 |
28.75 - 32.31 |
1.0227 times |
Mon 30 September 2024 |
30.09 (-5.97%) |
31.60 |
29.28 - 32.50 |
0.8732 times |

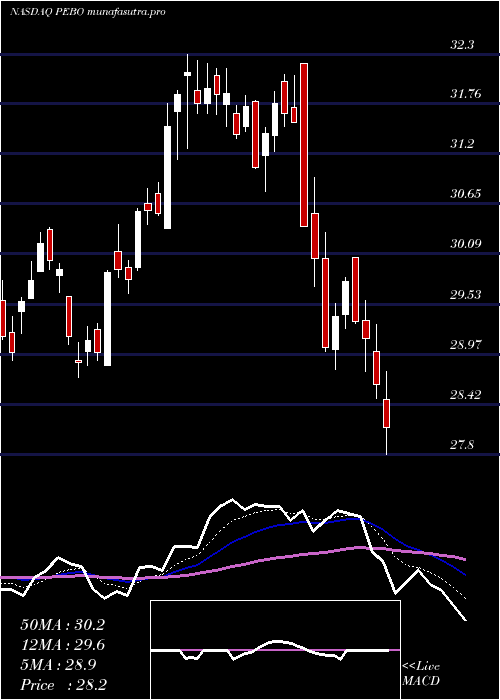
DMA SMA EMA moving averages of Peoples Bancorp PEBO
DMA (daily moving average) of Peoples Bancorp PEBO
| DMA period | DMA value | | 5 day DMA | 31.76 | | 12 day DMA | 31.31 | | 20 day DMA | 30.58 | | 35 day DMA | 30.16 | | 50 day DMA | 30.09 | | 100 day DMA | 29.73 | | 150 day DMA | 30.66 | | 200 day DMA | 30.98 | EMA (exponential moving average) of Peoples Bancorp PEBO
| EMA period | EMA current | EMA prev | EMA prev2 | | 5 day EMA | 31.65 | 31.77 | 31.72 | | 12 day EMA | 31.28 | 31.26 | 31.15 | | 20 day EMA | 30.9 | 30.85 | 30.74 | | 35 day EMA | 30.48 | 30.42 | 30.33 | | 50 day EMA | 30.12 | 30.07 | 30 |
SMA (simple moving average) of Peoples Bancorp PEBO
| SMA period | SMA current | SMA prev | SMA prev2 | | 5 day SMA | 31.76 | 31.9 | 31.9 | | 12 day SMA | 31.31 | 31.19 | 31.02 | | 20 day SMA | 30.58 | 30.52 | 30.42 | | 35 day SMA | 30.16 | 30.14 | 30.11 | | 50 day SMA | 30.09 | 30.05 | 29.98 | | 100 day SMA | 29.73 | 29.74 | 29.75 | | 150 day SMA | 30.66 | 30.69 | 30.72 | | 200 day SMA | 30.98 | 30.98 | 30.98 |
|
|
