OxfordLane OXLC full analysis,charts,indicators,moving averages,SMA,DMA,EMA,ADX,MACD,RSIOxford Lane OXLC WideScreen charts, DMA,SMA,EMA technical analysis, forecast prediction, by indicators ADX,MACD,RSI,CCI NASDAQ stock exchange
operates under N A sector & deals in N A
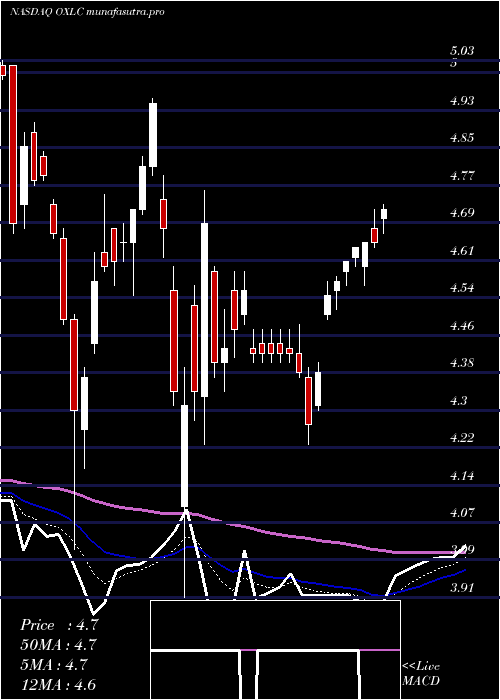
Daily price and charts and targets OxfordLane Strong Daily Stock price targets for OxfordLane OXLC are 4.12 and 4.17 | Daily Target 1 | 4.11 | | Daily Target 2 | 4.13 | | Daily Target 3 | 4.1566666666667 | | Daily Target 4 | 4.18 | | Daily Target 5 | 4.21 |
Daily price and volume Oxford Lane
| Date |
Closing |
Open |
Range |
Volume |
Tue 15 July 2025 |
4.16 (0%) |
4.18 |
4.13 - 4.18 |
1.047 times |
Mon 14 July 2025 |
4.16 (0.97%) |
4.13 |
4.12 - 4.18 |
1.236 times |
Fri 11 July 2025 |
4.12 (-0.96%) |
4.15 |
4.11 - 4.16 |
0.9436 times |
Thu 10 July 2025 |
4.16 (0.48%) |
4.15 |
4.14 - 4.20 |
0.7223 times |
Wed 09 July 2025 |
4.14 (-0.48%) |
4.16 |
4.14 - 4.20 |
0.8397 times |
Tue 08 July 2025 |
4.16 (0%) |
4.16 |
4.13 - 4.17 |
0.7102 times |
Mon 07 July 2025 |
4.16 (-1.19%) |
4.20 |
4.13 - 4.21 |
1.1901 times |
Thu 03 July 2025 |
4.21 (0.48%) |
4.20 |
4.19 - 4.23 |
0.8629 times |
Wed 02 July 2025 |
4.19 (0%) |
4.21 |
4.18 - 4.22 |
1.2476 times |
Tue 01 July 2025 |
4.19 (-0.24%) |
4.20 |
4.16 - 4.21 |
1.2007 times |
Mon 30 June 2025 |
4.20 (1.45%) |
4.16 |
4.16 - 4.23 |
1.3344 times |
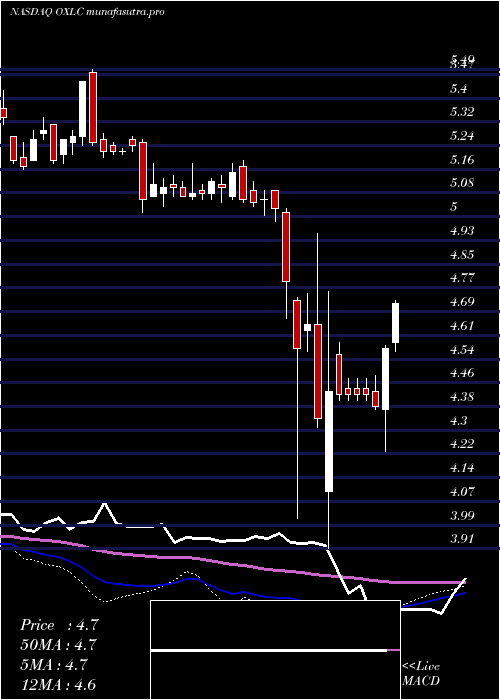
Weekly price and charts OxfordLane Strong weekly Stock price targets for OxfordLane OXLC are 4.14 and 4.2 | Weekly Target 1 | 4.09 | | Weekly Target 2 | 4.13 | | Weekly Target 3 | 4.1533333333333 | | Weekly Target 4 | 4.19 | | Weekly Target 5 | 4.21 |
Weekly price and volumes for Oxford Lane
| Date |
Closing |
Open |
Range |
Volume |
Tue 15 July 2025 |
4.16 (0.97%) |
4.13 |
4.12 - 4.18 |
0.3767 times |
Fri 11 July 2025 |
4.12 (-2.14%) |
4.20 |
4.11 - 4.21 |
0.7271 times |
Thu 03 July 2025 |
4.21 (1.69%) |
4.16 |
4.16 - 4.23 |
0.7666 times |
Fri 27 June 2025 |
4.14 (1.47%) |
4.07 |
3.93 - 4.16 |
1.0618 times |
Fri 20 June 2025 |
4.08 (-6.64%) |
4.19 |
4.05 - 4.20 |
0.916 times |
Fri 13 June 2025 |
4.37 (-2.67%) |
4.50 |
4.31 - 4.54 |
1.1115 times |
Fri 06 June 2025 |
4.49 (-0.88%) |
4.52 |
4.39 - 4.54 |
1.0863 times |
Fri 30 May 2025 |
4.53 (2.26%) |
4.45 |
4.37 - 4.54 |
1.2652 times |
Fri 23 May 2025 |
4.43 (-9.22%) |
4.65 |
4.42 - 4.77 |
1.5746 times |
Fri 16 May 2025 |
4.88 (2.09%) |
4.87 |
4.81 - 4.98 |
1.1142 times |
Fri 09 May 2025 |
4.78 (1.27%) |
4.71 |
4.64 - 4.78 |
0.8343 times |
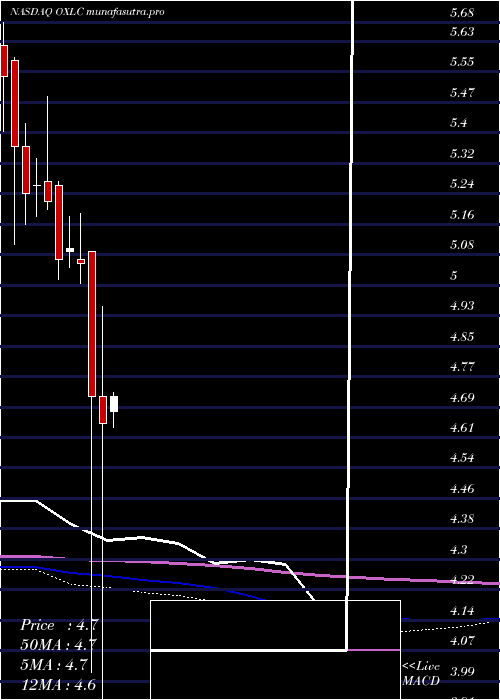
Monthly price and charts OxfordLane Strong monthly Stock price targets for OxfordLane OXLC are 4.08 and 4.2 | Monthly Target 1 | 4.05 | | Monthly Target 2 | 4.1 | | Monthly Target 3 | 4.1666666666667 | | Monthly Target 4 | 4.22 | | Monthly Target 5 | 4.29 |
Monthly price and volumes Oxford Lane
| Date |
Closing |
Open |
Range |
Volume |
Tue 15 July 2025 |
4.16 (-0.95%) |
4.20 |
4.11 - 4.23 |
0.3591 times |
Mon 30 June 2025 |
4.20 (-7.28%) |
4.52 |
3.93 - 4.54 |
0.9567 times |
Fri 30 May 2025 |
4.53 (-2.58%) |
4.68 |
4.37 - 4.98 |
1.1043 times |
Wed 30 April 2025 |
4.65 (-1.48%) |
4.72 |
3.91 - 4.95 |
1.362 times |
Mon 31 March 2025 |
4.72 (-6.72%) |
5.09 |
4.01 - 5.09 |
1.7087 times |
Fri 28 February 2025 |
5.06 (-0.78%) |
5.07 |
5.01 - 5.19 |
1.1847 times |
Fri 31 January 2025 |
5.10 (0.59%) |
5.09 |
5.05 - 5.18 |
0.9449 times |
Tue 31 December 2024 |
5.07 (-2.87%) |
5.26 |
5.02 - 5.27 |
0.8797 times |
Tue 26 November 2024 |
5.22 (-0.76%) |
5.27 |
5.20 - 5.49 |
0.788 times |
Thu 31 October 2024 |
5.26 (0.38%) |
5.26 |
5.18 - 5.33 |
0.7118 times |
Mon 30 September 2024 |
5.24 (-2.24%) |
5.36 |
5.16 - 5.42 |
0.6924 times |
DMA SMA EMA moving averages of Oxford Lane OXLC
DMA (daily moving average) of Oxford Lane OXLC
| DMA period | DMA value | | 5 day DMA | 4.15 | | 12 day DMA | 4.17 | | 20 day DMA | 4.14 | | 35 day DMA | 4.28 | | 50 day DMA | 4.42 | | 100 day DMA | 4.55 | | 150 day DMA | 4.74 | | 200 day DMA | 4.87 | EMA (exponential moving average) of Oxford Lane OXLC
| EMA period | EMA current | EMA prev | EMA prev2 | | 5 day EMA | 4.15 | 4.15 | 4.15 | | 12 day EMA | 4.16 | 4.16 | 4.16 | | 20 day EMA | 4.2 | 4.2 | 4.2 | | 35 day EMA | 4.29 | 4.3 | 4.31 | | 50 day EMA | 4.42 | 4.43 | 4.44 |
SMA (simple moving average) of Oxford Lane OXLC
| SMA period | SMA current | SMA prev | SMA prev2 | | 5 day SMA | 4.15 | 4.15 | 4.15 | | 12 day SMA | 4.17 | 4.16 | 4.15 | | 20 day SMA | 4.14 | 4.15 | 4.17 | | 35 day SMA | 4.28 | 4.29 | 4.3 | | 50 day SMA | 4.42 | 4.43 | 4.44 | | 100 day SMA | 4.55 | 4.56 | 4.57 | | 150 day SMA | 4.74 | 4.75 | 4.75 | | 200 day SMA | 4.87 | 4.88 | 4.88 |
|
|
