OxbridgeRe OXBRW full analysis,charts,indicators,moving averages,SMA,DMA,EMA,ADX,MACD,RSIOxbridge Re OXBRW WideScreen charts, DMA,SMA,EMA technical analysis, forecast prediction, by indicators ADX,MACD,RSI,CCI NASDAQ stock exchange
operates under Finance sector & deals in Property Casualty Insurers
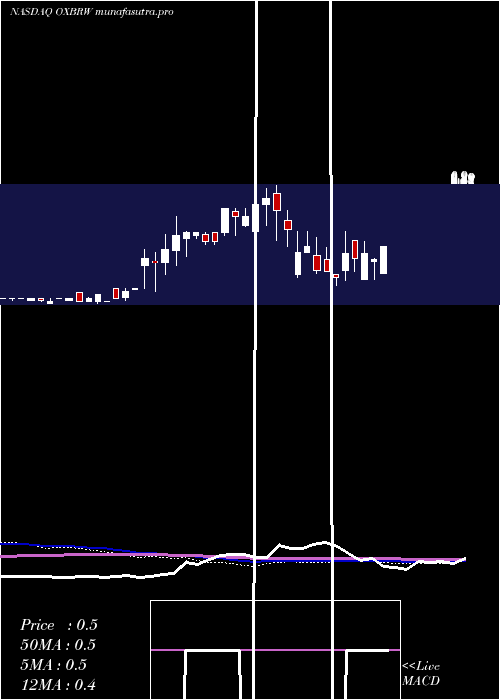
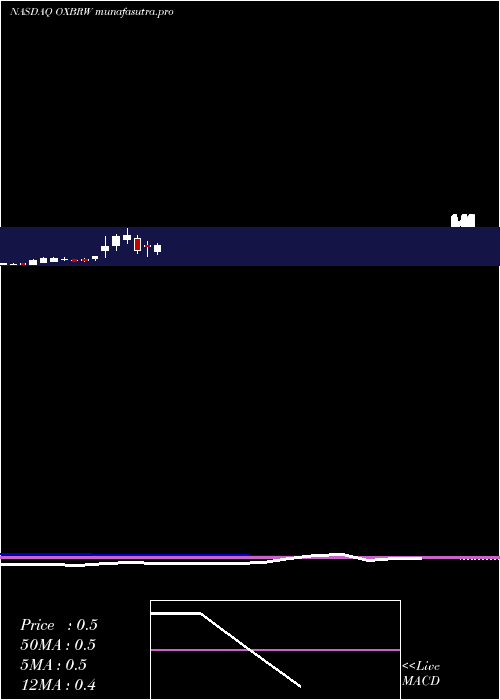
Daily price and charts and targets OxbridgeRe Strong Daily Stock price targets for OxbridgeRe OXBRW are 0.54 and 0.66 | Daily Target 1 | 0.44 | | Daily Target 2 | 0.52 | | Daily Target 3 | 0.56 | | Daily Target 4 | 0.64 | | Daily Target 5 | 0.68 |
Daily price and volume Oxbridge Re
| Date |
Closing |
Open |
Range |
Volume |
Tue 15 July 2025 |
0.60 (25%) |
0.48 |
0.48 - 0.60 |
0.3274 times |
Mon 14 July 2025 |
0.48 (20%) |
0.40 |
0.35 - 0.57 |
5.8333 times |
Fri 11 July 2025 |
0.40 (0%) |
0.40 |
0.40 - 0.42 |
0.6548 times |
Thu 10 July 2025 |
0.40 (2.56%) |
0.40 |
0.40 - 0.40 |
0.2976 times |
Mon 07 July 2025 |
0.39 (14.71%) |
0.39 |
0.39 - 0.39 |
0.119 times |
Tue 01 July 2025 |
0.34 (3.03%) |
0.33 |
0.33 - 0.34 |
0.6548 times |
Mon 30 June 2025 |
0.33 (3.13%) |
0.33 |
0.33 - 0.33 |
1.0417 times |
Fri 27 June 2025 |
0.32 (-3.03%) |
0.32 |
0.32 - 0.32 |
0.119 times |
Thu 26 June 2025 |
0.33 (3.13%) |
0.33 |
0.33 - 0.33 |
0.0298 times |
Wed 25 June 2025 |
0.32 (14.29%) |
0.32 |
0.30 - 0.32 |
0.9226 times |
Tue 24 June 2025 |
0.28 (-3.45%) |
0.30 |
0.28 - 0.30 |
0.0595 times |

Weekly price and charts OxbridgeRe Strong weekly Stock price targets for OxbridgeRe OXBRW are 0.48 and 0.73 | Weekly Target 1 | 0.27 | | Weekly Target 2 | 0.43 | | Weekly Target 3 | 0.51666666666667 | | Weekly Target 4 | 0.68 | | Weekly Target 5 | 0.77 |
Weekly price and volumes for Oxbridge Re
| Date |
Closing |
Open |
Range |
Volume |
Tue 15 July 2025 |
0.60 (50%) |
0.40 |
0.35 - 0.60 |
2.7898 times |
Fri 11 July 2025 |
0.40 (17.65%) |
0.39 |
0.39 - 0.42 |
0.4852 times |
Tue 01 July 2025 |
0.34 (6.25%) |
0.33 |
0.33 - 0.34 |
0.7682 times |
Fri 27 June 2025 |
0.32 (10.34%) |
0.30 |
0.28 - 0.33 |
0.7817 times |
Wed 18 June 2025 |
0.29 (-3.33%) |
0.36 |
0.29 - 0.36 |
0.0674 times |
Fri 13 June 2025 |
0.30 (-18.92%) |
0.35 |
0.30 - 0.35 |
0.283 times |
Fri 06 June 2025 |
0.37 (-15.91%) |
0.46 |
0.37 - 0.49 |
0.1348 times |
Fri 30 May 2025 |
0.44 (-12%) |
0.50 |
0.37 - 0.50 |
0.903 times |
Fri 23 May 2025 |
0.50 (21.95%) |
0.32 |
0.32 - 0.50 |
2.7089 times |
Fri 16 May 2025 |
0.41 (-8.89%) |
0.40 |
0.28 - 0.42 |
1.0782 times |
Fri 09 May 2025 |
0.45 (7.14%) |
0.28 |
0.28 - 0.53 |
2.965 times |
Monthly price and charts OxbridgeRe Strong monthly Stock price targets for OxbridgeRe OXBRW are 0.47 and 0.74 | Monthly Target 1 | 0.24 | | Monthly Target 2 | 0.42 | | Monthly Target 3 | 0.51 | | Monthly Target 4 | 0.69 | | Monthly Target 5 | 0.78 |
Monthly price and volumes Oxbridge Re
| Date |
Closing |
Open |
Range |
Volume |
Tue 15 July 2025 |
0.60 (81.82%) |
0.33 |
0.33 - 0.60 |
0.2735 times |
Mon 30 June 2025 |
0.33 (-25%) |
0.46 |
0.28 - 0.49 |
0.1331 times |
Fri 30 May 2025 |
0.44 (-8.33%) |
0.35 |
0.28 - 0.53 |
0.6604 times |
Mon 21 April 2025 |
0.48 (26.32%) |
0.49 |
0.24 - 0.60 |
0.254 times |
Mon 31 March 2025 |
0.38 (-48.65%) |
0.67 |
0.29 - 0.74 |
0.9052 times |
Fri 28 February 2025 |
0.74 (5.71%) |
0.64 |
0.54 - 0.90 |
1.9081 times |
Fri 31 January 2025 |
0.70 (45.83%) |
0.50 |
0.37 - 0.75 |
1.8863 times |
Tue 31 December 2024 |
0.48 (118.18%) |
0.37 |
0.20 - 0.70 |
1.8267 times |
Mon 25 November 2024 |
0.22 (57.14%) |
0.18 |
0.13 - 0.22 |
0.2301 times |
Thu 31 October 2024 |
0.14 (7.69%) |
0.15 |
0.12 - 0.19 |
1.9225 times |
Wed 25 September 2024 |
0.13 (-13.33%) |
0.14 |
0.12 - 0.15 |
0.5634 times |
DMA SMA EMA moving averages of Oxbridge Re OXBRW
DMA (daily moving average) of Oxbridge Re OXBRW
| DMA period | DMA value | | 5 day DMA | 0.45 | | 12 day DMA | 0.37 | | 20 day DMA | 0.37 | | 35 day DMA | 0.39 | | 50 day DMA | 0.4 | | 100 day DMA | 0.52 | | 150 day DMA | 0.41 | | 200 day DMA | 0.34 | EMA (exponential moving average) of Oxbridge Re OXBRW
| EMA period | EMA current | EMA prev | EMA prev2 | | 5 day EMA | 0.47 | 0.41 | 0.38 | | 12 day EMA | 0.42 | 0.39 | 0.37 | | 20 day EMA | 0.4 | 0.38 | 0.37 | | 35 day EMA | 0.41 | 0.4 | 0.39 | | 50 day EMA | 0.42 | 0.41 | 0.41 |
SMA (simple moving average) of Oxbridge Re OXBRW
| SMA period | SMA current | SMA prev | SMA prev2 | | 5 day SMA | 0.45 | 0.4 | 0.37 | | 12 day SMA | 0.37 | 0.35 | 0.34 | | 20 day SMA | 0.37 | 0.37 | 0.36 | | 35 day SMA | 0.39 | 0.39 | 0.39 | | 50 day SMA | 0.4 | 0.4 | 0.4 | | 100 day SMA | 0.52 | 0.51 | 0.51 | | 150 day SMA | 0.41 | 0.41 | 0.4 | | 200 day SMA | 0.34 | 0.34 | 0.33 |
|
|
