OldPoint OPOF full analysis,charts,indicators,moving averages,SMA,DMA,EMA,ADX,MACD,RSIOld Point OPOF WideScreen charts, DMA,SMA,EMA technical analysis, forecast prediction, by indicators ADX,MACD,RSI,CCI NASDAQ stock exchange
operates under Finance sector & deals in Major Banks
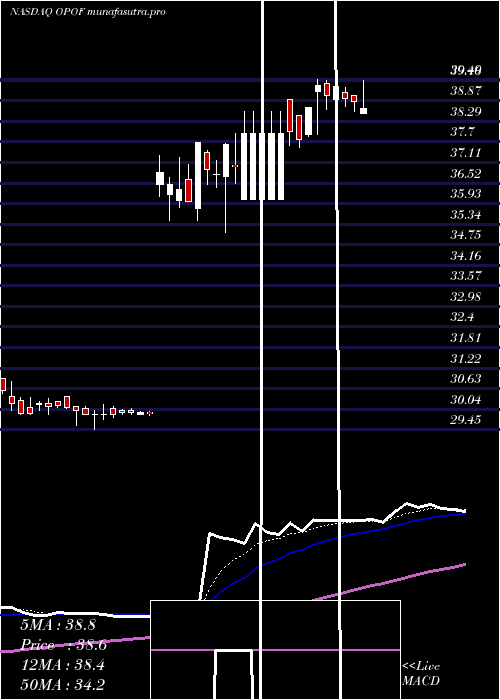
Daily price and charts and targets OldPoint Strong Daily Stock price targets for OldPoint OPOF are 40.29 and 41.37 | Daily Target 1 | 39.39 | | Daily Target 2 | 40.11 | | Daily Target 3 | 40.47 | | Daily Target 4 | 41.19 | | Daily Target 5 | 41.55 |
Daily price and volume Old Point
| Date |
Closing |
Open |
Range |
Volume |
Wed 16 July 2025 |
40.83 (1.87%) |
39.87 |
39.75 - 40.83 |
0.7492 times |
Tue 15 July 2025 |
40.08 (-1.43%) |
40.32 |
39.84 - 40.32 |
0.7272 times |
Mon 14 July 2025 |
40.66 (0.3%) |
40.47 |
40.31 - 41.00 |
0.6038 times |
Fri 11 July 2025 |
40.54 (-0.02%) |
40.51 |
40.27 - 40.91 |
0.4451 times |
Thu 10 July 2025 |
40.55 (0.2%) |
40.42 |
40.38 - 40.86 |
0.4804 times |
Wed 09 July 2025 |
40.47 (-1.05%) |
40.63 |
40.32 - 41.04 |
0.4407 times |
Tue 08 July 2025 |
40.90 (0.57%) |
40.42 |
40.42 - 41.33 |
1.071 times |
Mon 07 July 2025 |
40.67 (-0.02%) |
40.65 |
40.43 - 40.80 |
0.5818 times |
Thu 03 July 2025 |
40.68 (1.4%) |
40.29 |
40.29 - 40.68 |
3.4509 times |
Wed 02 July 2025 |
40.12 (-0.2%) |
40.01 |
39.96 - 40.44 |
1.45 times |
Tue 01 July 2025 |
40.20 (2.42%) |
39.12 |
39.12 - 40.24 |
1.1459 times |
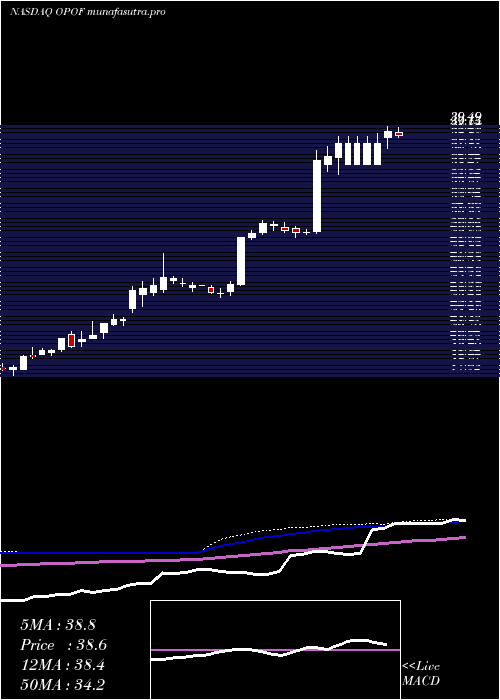
Weekly price and charts OldPoint Strong weekly Stock price targets for OldPoint OPOF are 40.29 and 41.54 | Weekly Target 1 | 39.28 | | Weekly Target 2 | 40.05 | | Weekly Target 3 | 40.526666666667 | | Weekly Target 4 | 41.3 | | Weekly Target 5 | 41.78 |
Weekly price and volumes for Old Point
| Date |
Closing |
Open |
Range |
Volume |
Wed 16 July 2025 |
40.83 (0.72%) |
40.47 |
39.75 - 41.00 |
0.3361 times |
Fri 11 July 2025 |
40.54 (-0.34%) |
40.65 |
40.27 - 41.33 |
0.4877 times |
Thu 03 July 2025 |
40.68 (1.88%) |
39.50 |
39.12 - 40.68 |
1.3236 times |
Fri 27 June 2025 |
39.93 (-1.92%) |
40.36 |
39.27 - 40.85 |
5.0331 times |
Fri 20 June 2025 |
40.71 (3.77%) |
38.81 |
38.51 - 40.95 |
1.0986 times |
Fri 13 June 2025 |
39.23 (0.33%) |
39.14 |
38.74 - 40.32 |
0.4543 times |
Fri 06 June 2025 |
39.10 (-1.14%) |
39.85 |
38.61 - 40.25 |
0.4464 times |
Fri 30 May 2025 |
39.55 (1.38%) |
38.95 |
38.83 - 40.30 |
0.2236 times |
Fri 23 May 2025 |
39.01 (-1.76%) |
39.92 |
39.01 - 40.88 |
0.3161 times |
Fri 16 May 2025 |
39.71 (1.38%) |
39.58 |
39.13 - 40.10 |
0.2805 times |
Fri 09 May 2025 |
39.17 (-0.84%) |
39.44 |
38.91 - 39.87 |
0.3211 times |
Monthly price and charts OldPoint Strong monthly Stock price targets for OldPoint OPOF are 39.98 and 42.19 | Monthly Target 1 | 38.22 | | Monthly Target 2 | 39.52 | | Monthly Target 3 | 40.426666666667 | | Monthly Target 4 | 41.73 | | Monthly Target 5 | 42.64 |
Monthly price and volumes Old Point
| Date |
Closing |
Open |
Range |
Volume |
Wed 16 July 2025 |
40.83 (4.03%) |
39.12 |
39.12 - 41.33 |
0.7887 times |
Mon 30 June 2025 |
39.25 (-0.76%) |
39.85 |
38.51 - 40.95 |
3.232 times |
Fri 30 May 2025 |
39.55 (1.83%) |
38.51 |
38.51 - 40.88 |
0.5835 times |
Wed 30 April 2025 |
38.84 (29.73%) |
29.90 |
29.85 - 39.49 |
2.3743 times |
Mon 31 March 2025 |
29.94 (-2.44%) |
30.50 |
29.45 - 30.93 |
0.6632 times |
Fri 28 February 2025 |
30.69 (25.78%) |
24.59 |
24.24 - 30.95 |
0.4135 times |
Fri 31 January 2025 |
24.40 (-6.37%) |
26.00 |
24.01 - 26.00 |
0.2341 times |
Tue 31 December 2024 |
26.06 (18.24%) |
23.07 |
22.70 - 28.00 |
0.2419 times |
Tue 26 November 2024 |
22.04 (11.2%) |
19.84 |
19.48 - 22.51 |
1.2989 times |
Thu 31 October 2024 |
19.82 (2.59%) |
19.35 |
18.75 - 21.00 |
0.17 times |
Mon 30 September 2024 |
19.32 (0.36%) |
19.20 |
17.02 - 19.32 |
0.2498 times |
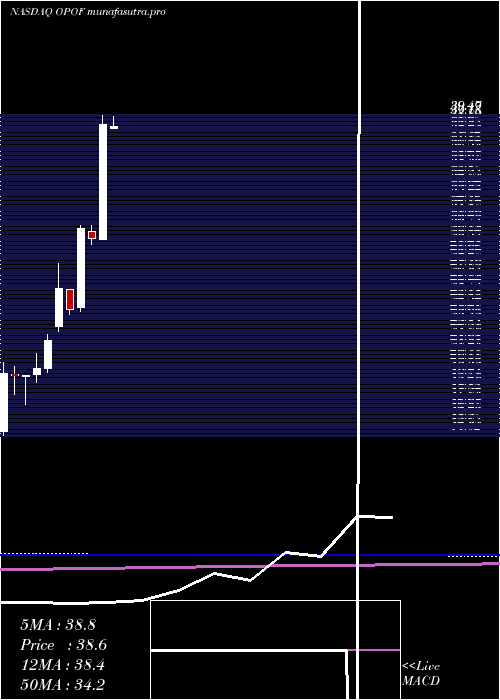
DMA SMA EMA moving averages of Old Point OPOF
DMA (daily moving average) of Old Point OPOF
| DMA period | DMA value | | 5 day DMA | 40.53 | | 12 day DMA | 40.41 | | 20 day DMA | 40.27 | | 35 day DMA | 39.88 | | 50 day DMA | 39.82 | | 100 day DMA | 36.75 | | 150 day DMA | 32.96 | | 200 day DMA | 29.64 | EMA (exponential moving average) of Old Point OPOF
| EMA period | EMA current | EMA prev | EMA prev2 | | 5 day EMA | 40.55 | 40.41 | 40.57 | | 12 day EMA | 40.42 | 40.34 | 40.39 | | 20 day EMA | 40.26 | 40.2 | 40.21 | | 35 day EMA | 40.05 | 40 | 40 | | 50 day EMA | 39.81 | 39.77 | 39.76 |
SMA (simple moving average) of Old Point OPOF
| SMA period | SMA current | SMA prev | SMA prev2 | | 5 day SMA | 40.53 | 40.46 | 40.62 | | 12 day SMA | 40.41 | 40.34 | 40.3 | | 20 day SMA | 40.27 | 40.19 | 40.15 | | 35 day SMA | 39.88 | 39.84 | 39.85 | | 50 day SMA | 39.82 | 39.78 | 39.76 | | 100 day SMA | 36.75 | 36.64 | 36.53 | | 150 day SMA | 32.96 | 32.84 | 32.72 | | 200 day SMA | 29.64 | 29.53 | 29.41 |
|
|
