OfficeProperties OPINL full analysis,charts,indicators,moving averages,SMA,DMA,EMA,ADX,MACD,RSIOffice Properties OPINL WideScreen charts, DMA,SMA,EMA technical analysis, forecast prediction, by indicators ADX,MACD,RSI,CCI NASDAQ stock exchange
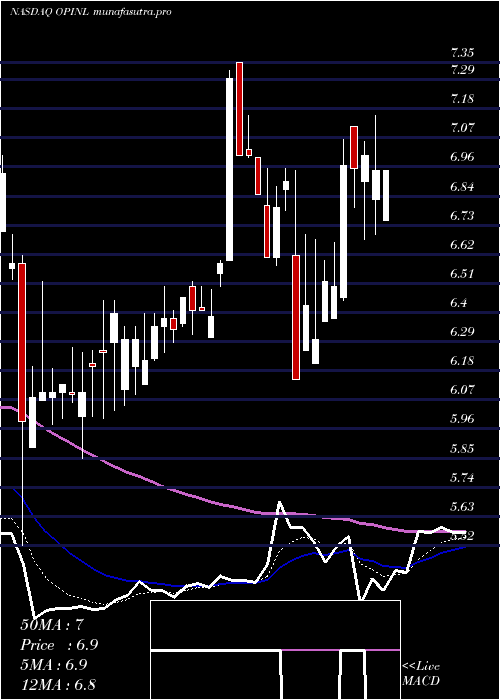
Daily price and charts and targets OfficeProperties Strong Daily Stock price targets for OfficeProperties OPINL are 6.85 and 7.22 | Daily Target 1 | 6.75 | | Daily Target 2 | 6.94 | | Daily Target 3 | 7.12 | | Daily Target 4 | 7.31 | | Daily Target 5 | 7.49 |
Daily price and volume Office Properties
| Date |
Closing |
Open |
Range |
Volume |
Fri 01 August 2025 |
7.13 (-2.86%) |
7.29 |
6.93 - 7.30 |
0.3659 times |
Thu 31 July 2025 |
7.34 (3.23%) |
7.16 |
7.07 - 7.43 |
2.628 times |
Wed 30 July 2025 |
7.11 (1.28%) |
6.93 |
6.92 - 7.20 |
1.2866 times |
Tue 29 July 2025 |
7.02 (3.24%) |
6.82 |
6.82 - 7.05 |
1.3659 times |
Mon 28 July 2025 |
6.80 (-2.02%) |
6.90 |
6.71 - 7.02 |
0.8049 times |
Fri 25 July 2025 |
6.94 (-0.86%) |
7.10 |
6.87 - 7.10 |
0.9451 times |
Thu 24 July 2025 |
7.00 (1.16%) |
6.79 |
6.78 - 7.05 |
0.3537 times |
Wed 23 July 2025 |
6.92 (0.58%) |
6.96 |
6.73 - 7.05 |
1.4695 times |
Tue 22 July 2025 |
6.88 (3.61%) |
6.70 |
6.64 - 6.90 |
0.0854 times |
Mon 21 July 2025 |
6.64 (-3.91%) |
6.97 |
6.64 - 6.99 |
0.6951 times |
Fri 18 July 2025 |
6.91 (0.44%) |
6.79 |
6.79 - 7.05 |
1.844 times |
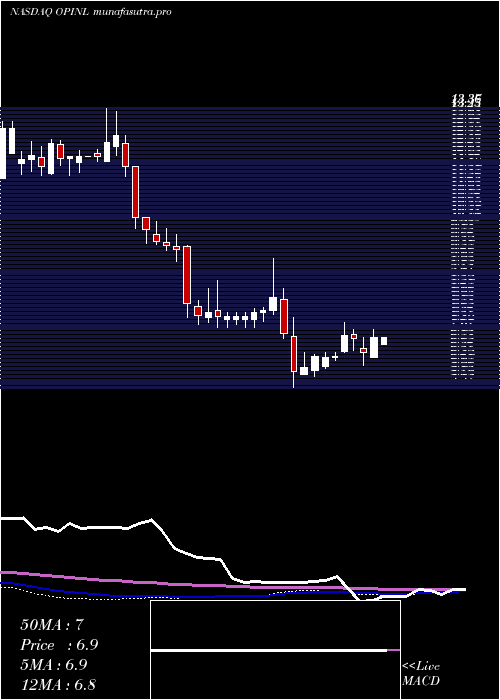
Weekly price and charts OfficeProperties Strong weekly Stock price targets for OfficeProperties OPINL are 6.92 and 7.64 | Weekly Target 1 | 6.37 | | Weekly Target 2 | 6.75 | | Weekly Target 3 | 7.09 | | Weekly Target 4 | 7.47 | | Weekly Target 5 | 7.81 |
Weekly price and volumes for Office Properties
| Date |
Closing |
Open |
Range |
Volume |
Fri 01 August 2025 |
7.13 (2.74%) |
6.90 |
6.71 - 7.43 |
1.2463 times |
Fri 25 July 2025 |
6.94 (0.43%) |
6.97 |
6.64 - 7.10 |
0.6856 times |
Fri 18 July 2025 |
6.91 (-0.43%) |
6.75 |
6.66 - 7.05 |
1.023 times |
Fri 11 July 2025 |
6.94 (6.44%) |
6.38 |
6.38 - 7.15 |
1.7245 times |
Thu 03 July 2025 |
6.52 (-5.51%) |
6.62 |
6.15 - 6.94 |
1.0837 times |
Fri 27 June 2025 |
6.90 (-1.43%) |
7.02 |
6.58 - 7.15 |
0.3063 times |
Fri 20 June 2025 |
7.00 (9.55%) |
6.55 |
6.50 - 7.35 |
0.3451 times |
Fri 13 June 2025 |
6.39 (0.16%) |
6.38 |
6.29 - 6.52 |
0.4971 times |
Fri 06 June 2025 |
6.38 (-0.31%) |
6.11 |
6.05 - 6.50 |
1.1049 times |
Fri 30 May 2025 |
6.40 (5.09%) |
6.01 |
5.85 - 6.45 |
1.9836 times |
Fri 23 May 2025 |
6.09 (1.67%) |
5.89 |
5.89 - 6.52 |
1.2251 times |
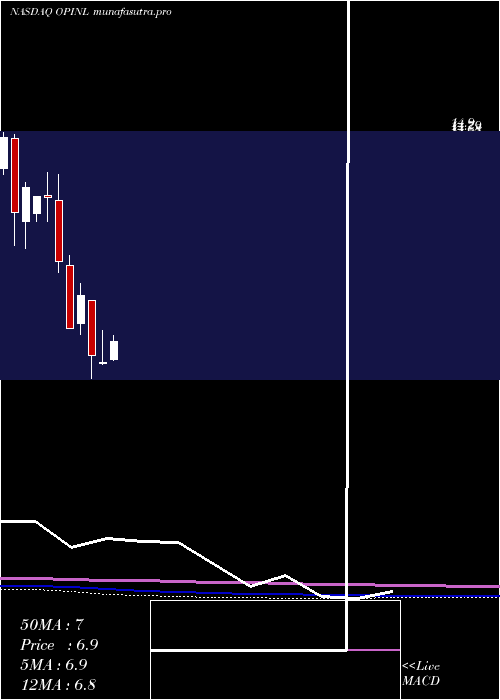
Monthly price and charts OfficeProperties Strong monthly Stock price targets for OfficeProperties OPINL are 6.85 and 7.22 | Monthly Target 1 | 6.75 | | Monthly Target 2 | 6.94 | | Monthly Target 3 | 7.12 | | Monthly Target 4 | 7.31 | | Monthly Target 5 | 7.49 |
Monthly price and volumes Office Properties
| Date |
Closing |
Open |
Range |
Volume |
Fri 01 August 2025 |
7.13 (-2.86%) |
7.29 |
6.93 - 7.30 |
0.0164 times |
Thu 31 July 2025 |
7.34 (19.35%) |
6.26 |
6.21 - 7.43 |
1.1472 times |
Mon 30 June 2025 |
6.15 (-3.91%) |
6.11 |
6.05 - 7.35 |
0.6968 times |
Fri 30 May 2025 |
6.40 (-26.44%) |
8.50 |
5.52 - 8.50 |
1.3133 times |
Wed 30 April 2025 |
8.70 (16.94%) |
7.62 |
7.22 - 9.15 |
1.1815 times |
Mon 31 March 2025 |
7.44 (-25.38%) |
9.82 |
7.44 - 10.21 |
1.9176 times |
Fri 28 February 2025 |
9.97 (-19.66%) |
12.30 |
9.57 - 13.30 |
1.0202 times |
Fri 31 January 2025 |
12.41 (-0.32%) |
12.50 |
11.50 - 13.37 |
0.4114 times |
Tue 31 December 2024 |
12.45 (-2.73%) |
11.82 |
11.50 - 12.45 |
0.6815 times |
Tue 26 November 2024 |
12.80 (7.83%) |
11.50 |
10.50 - 13.00 |
1.6142 times |
Thu 31 October 2024 |
11.87 (-19.25%) |
14.68 |
10.61 - 14.83 |
1.609 times |
DMA SMA EMA moving averages of Office Properties OPINL
DMA (daily moving average) of Office Properties OPINL
| DMA period | DMA value | | 5 day DMA | 7.08 | | 12 day DMA | 6.96 | | 20 day DMA | 6.92 | | 35 day DMA | 6.8 | | 50 day DMA | 6.64 | | 100 day DMA | 7.31 | | 150 day DMA | 8.72 | | 200 day DMA | 9.69 | EMA (exponential moving average) of Office Properties OPINL
| EMA period | EMA current | EMA prev | EMA prev2 | | 5 day EMA | 7.11 | 7.1 | 6.98 | | 12 day EMA | 7 | 6.98 | 6.92 | | 20 day EMA | 6.93 | 6.91 | 6.86 | | 35 day EMA | 6.8 | 6.78 | 6.75 | | 50 day EMA | 6.68 | 6.66 | 6.63 |
SMA (simple moving average) of Office Properties OPINL
| SMA period | SMA current | SMA prev | SMA prev2 | | 5 day SMA | 7.08 | 7.04 | 6.97 | | 12 day SMA | 6.96 | 6.94 | 6.89 | | 20 day SMA | 6.92 | 6.89 | 6.84 | | 35 day SMA | 6.8 | 6.78 | 6.75 | | 50 day SMA | 6.64 | 6.61 | 6.59 | | 100 day SMA | 7.31 | 7.34 | 7.36 | | 150 day SMA | 8.72 | 8.76 | 8.79 | | 200 day SMA | 9.69 | 9.73 | 9.76 |
|
|
