OldNational ONB full analysis,charts,indicators,moving averages,SMA,DMA,EMA,ADX,MACD,RSIOld National ONB WideScreen charts, DMA,SMA,EMA technical analysis, forecast prediction, by indicators ADX,MACD,RSI,CCI NASDAQ stock exchange
operates under Finance sector & deals in Major Banks
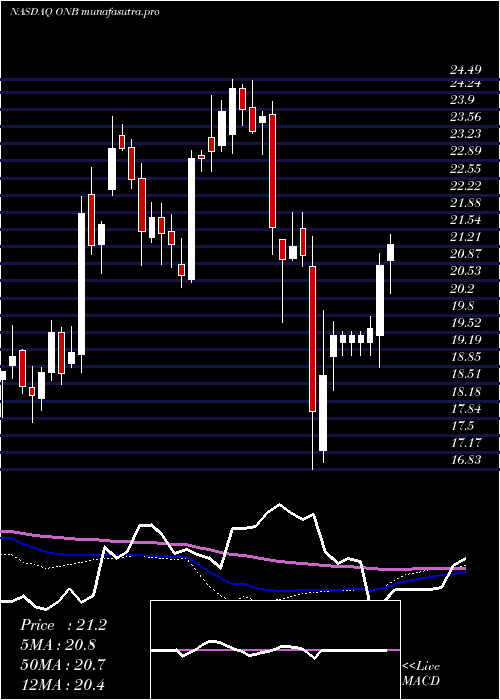
Daily price and charts and targets OldNational Strong Daily Stock price targets for OldNational ONB are 23.17 and 23.51 | Daily Target 1 | 22.89 | | Daily Target 2 | 23.11 | | Daily Target 3 | 23.233333333333 | | Daily Target 4 | 23.45 | | Daily Target 5 | 23.57 |
Daily price and volume Old National
| Date |
Closing |
Open |
Range |
Volume |
Mon 14 July 2025 |
23.32 (0.69%) |
23.08 |
23.02 - 23.36 |
0.975 times |
Fri 11 July 2025 |
23.16 (-1.32%) |
23.25 |
22.99 - 23.31 |
0.9115 times |
Thu 10 July 2025 |
23.47 (1.12%) |
23.17 |
22.99 - 23.61 |
1.5115 times |
Wed 09 July 2025 |
23.21 (1.31%) |
23.11 |
22.96 - 23.29 |
1.4292 times |
Tue 08 July 2025 |
22.91 (1.46%) |
22.72 |
22.61 - 22.96 |
0.9684 times |
Mon 07 July 2025 |
22.58 (-0.79%) |
22.63 |
22.44 - 23.00 |
0.8506 times |
Thu 03 July 2025 |
22.76 (1.16%) |
22.58 |
22.50 - 22.99 |
0.5902 times |
Wed 02 July 2025 |
22.50 (1.53%) |
22.15 |
22.05 - 22.53 |
1.0237 times |
Tue 01 July 2025 |
22.16 (3.84%) |
21.25 |
21.16 - 22.45 |
0.9551 times |
Mon 30 June 2025 |
21.34 (-0.14%) |
21.46 |
21.33 - 21.63 |
0.7848 times |
Fri 27 June 2025 |
21.37 (-0.28%) |
21.49 |
21.25 - 21.70 |
3.1081 times |

Weekly price and charts OldNational Strong weekly Stock price targets for OldNational ONB are 23.17 and 23.51 | Weekly Target 1 | 22.89 | | Weekly Target 2 | 23.11 | | Weekly Target 3 | 23.233333333333 | | Weekly Target 4 | 23.45 | | Weekly Target 5 | 23.57 |
Weekly price and volumes for Old National
| Date |
Closing |
Open |
Range |
Volume |
Mon 14 July 2025 |
23.32 (0.69%) |
23.08 |
23.02 - 23.36 |
0.1953 times |
Fri 11 July 2025 |
23.16 (1.76%) |
22.63 |
22.44 - 23.61 |
1.136 times |
Thu 03 July 2025 |
22.76 (6.5%) |
21.46 |
21.16 - 22.99 |
0.6718 times |
Fri 27 June 2025 |
21.37 (4.14%) |
20.49 |
20.31 - 21.70 |
1.4976 times |
Fri 20 June 2025 |
20.52 (0.49%) |
20.46 |
20.19 - 20.73 |
0.6268 times |
Fri 13 June 2025 |
20.42 (-3.91%) |
21.37 |
20.32 - 21.72 |
0.8382 times |
Fri 06 June 2025 |
21.25 (1.87%) |
20.84 |
20.32 - 21.27 |
0.8136 times |
Fri 30 May 2025 |
20.86 (1.21%) |
20.88 |
20.64 - 21.62 |
0.7584 times |
Fri 23 May 2025 |
20.61 (-6.87%) |
21.87 |
20.17 - 22.09 |
2.3229 times |
Fri 16 May 2025 |
22.13 (3.41%) |
22.34 |
21.98 - 22.70 |
1.1394 times |
Fri 09 May 2025 |
21.40 (0.75%) |
21.03 |
20.79 - 21.76 |
0.6814 times |
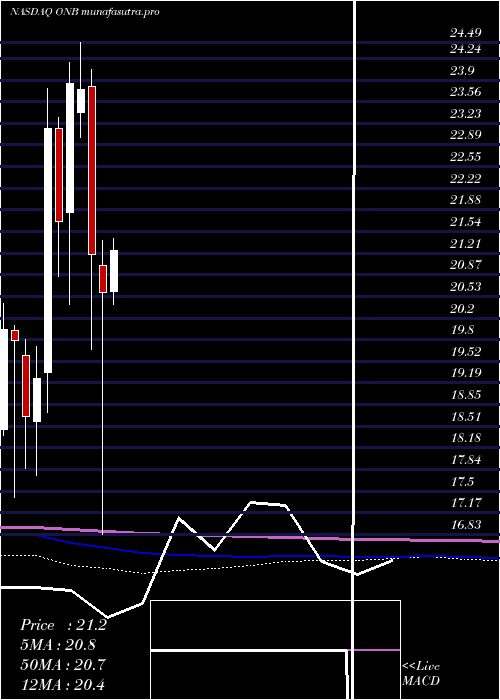
Monthly price and charts OldNational Strong monthly Stock price targets for OldNational ONB are 22.24 and 24.69 | Monthly Target 1 | 20.25 | | Monthly Target 2 | 21.78 | | Monthly Target 3 | 22.696666666667 | | Monthly Target 4 | 24.23 | | Monthly Target 5 | 25.15 |
Monthly price and volumes Old National
| Date |
Closing |
Open |
Range |
Volume |
Mon 14 July 2025 |
23.32 (9.28%) |
21.25 |
21.16 - 23.61 |
0.4702 times |
Mon 30 June 2025 |
21.34 (2.3%) |
20.84 |
20.19 - 21.72 |
1.0019 times |
Fri 30 May 2025 |
20.86 (1.31%) |
20.61 |
20.17 - 22.70 |
1.3725 times |
Wed 30 April 2025 |
20.59 (-2.83%) |
21.01 |
16.83 - 21.40 |
1.2952 times |
Mon 31 March 2025 |
21.19 (-10.78%) |
23.80 |
19.71 - 24.06 |
0.9146 times |
Fri 28 February 2025 |
23.75 (-0.42%) |
23.40 |
23.01 - 24.49 |
0.8871 times |
Fri 31 January 2025 |
23.85 (9.91%) |
21.84 |
20.41 - 24.17 |
1.4626 times |
Tue 31 December 2024 |
21.70 (-6.22%) |
23.15 |
20.84 - 23.31 |
0.6263 times |
Tue 26 November 2024 |
23.14 (20.15%) |
19.35 |
18.73 - 23.76 |
1.225 times |
Thu 31 October 2024 |
19.26 (3.22%) |
18.59 |
17.75 - 19.75 |
0.7445 times |
Mon 30 September 2024 |
18.66 (-5.99%) |
19.61 |
17.85 - 19.87 |
0.6109 times |
DMA SMA EMA moving averages of Old National ONB
DMA (daily moving average) of Old National ONB
| DMA period | DMA value | | 5 day DMA | 23.21 | | 12 day DMA | 22.52 | | 20 day DMA | 21.81 | | 35 day DMA | 21.46 | | 50 day DMA | 21.51 | | 100 day DMA | 21.19 | | 150 day DMA | 21.69 | | 200 day DMA | 21.2 | EMA (exponential moving average) of Old National ONB
| EMA period | EMA current | EMA prev | EMA prev2 | | 5 day EMA | 23.13 | 23.04 | 22.98 | | 12 day EMA | 22.6 | 22.47 | 22.34 | | 20 day EMA | 22.21 | 22.09 | 21.98 | | 35 day EMA | 21.85 | 21.76 | 21.68 | | 50 day EMA | 21.61 | 21.54 | 21.47 |
SMA (simple moving average) of Old National ONB
| SMA period | SMA current | SMA prev | SMA prev2 | | 5 day SMA | 23.21 | 23.07 | 22.99 | | 12 day SMA | 22.52 | 22.33 | 22.16 | | 20 day SMA | 21.81 | 21.7 | 21.62 | | 35 day SMA | 21.46 | 21.41 | 21.38 | | 50 day SMA | 21.51 | 21.46 | 21.41 | | 100 day SMA | 21.19 | 21.2 | 21.21 | | 150 day SMA | 21.69 | 21.69 | 21.69 | | 200 day SMA | 21.2 | 21.17 | 21.15 |
|
|
