OllieS OLLI full analysis,charts,indicators,moving averages,SMA,DMA,EMA,ADX,MACD,RSIOllie S OLLI WideScreen charts, DMA,SMA,EMA technical analysis, forecast prediction, by indicators ADX,MACD,RSI,CCI NASDAQ stock exchange
operates under Consumer Services sector & deals in Department Specialty Retail Stores
Daily price and charts and targets OllieS Strong Daily Stock price targets for OllieS OLLI are 134.15 and 142.05 | Daily Target 1 | 127.59 | | Daily Target 2 | 132.81 | | Daily Target 3 | 135.48666666667 | | Daily Target 4 | 140.71 | | Daily Target 5 | 143.39 |
Daily price and volume Ollie S
| Date |
Closing |
Open |
Range |
Volume |
Fri 01 August 2025 |
138.04 (1.03%) |
133.71 |
130.26 - 138.16 |
0.8456 times |
Thu 31 July 2025 |
136.63 (-1.36%) |
139.68 |
136.05 - 140.25 |
0.9634 times |
Wed 30 July 2025 |
138.51 (0.45%) |
138.86 |
136.54 - 139.64 |
0.7373 times |
Tue 29 July 2025 |
137.89 (-1.04%) |
139.34 |
136.97 - 139.38 |
1.1657 times |
Mon 28 July 2025 |
139.34 (4.2%) |
133.94 |
133.80 - 140.24 |
1.7247 times |
Fri 25 July 2025 |
133.73 (1.5%) |
132.58 |
132.12 - 134.83 |
0.7572 times |
Thu 24 July 2025 |
131.75 (-0.16%) |
131.74 |
129.56 - 132.77 |
0.8996 times |
Wed 23 July 2025 |
131.96 (-2.26%) |
135.69 |
131.23 - 136.13 |
0.8057 times |
Tue 22 July 2025 |
135.01 (0.09%) |
135.57 |
133.69 - 136.98 |
0.9807 times |
Mon 21 July 2025 |
134.89 (2%) |
132.16 |
132.16 - 135.91 |
1.12 times |
Fri 18 July 2025 |
132.24 (0.27%) |
133.13 |
131.67 - 133.70 |
0.8185 times |
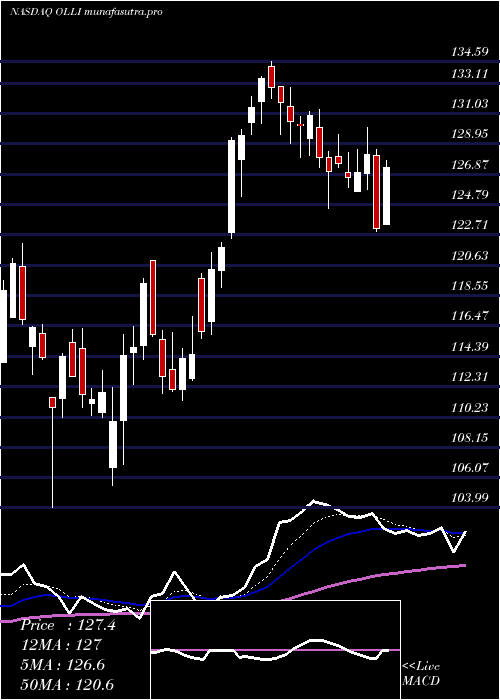
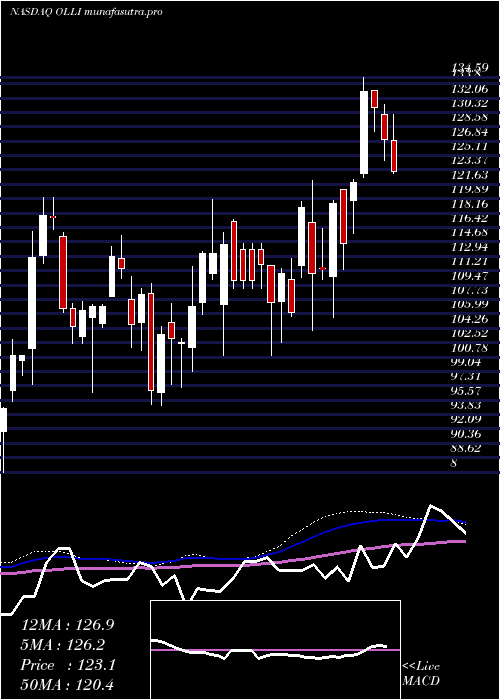
Weekly price and charts OllieS Strong weekly Stock price targets for OllieS OLLI are 134.15 and 144.14 | Weekly Target 1 | 126.19 | | Weekly Target 2 | 132.12 | | Weekly Target 3 | 136.18333333333 | | Weekly Target 4 | 142.11 | | Weekly Target 5 | 146.17 |
Weekly price and volumes for Ollie S
| Date |
Closing |
Open |
Range |
Volume |
Fri 01 August 2025 |
138.04 (3.22%) |
133.94 |
130.26 - 140.25 |
0.783 times |
Fri 25 July 2025 |
133.73 (1.13%) |
132.16 |
129.56 - 136.98 |
0.6572 times |
Fri 18 July 2025 |
132.24 (4.12%) |
126.94 |
122.94 - 133.70 |
1.0185 times |
Fri 11 July 2025 |
127.01 (-2.97%) |
130.07 |
124.51 - 131.28 |
0.8237 times |
Thu 03 July 2025 |
130.90 (-1.43%) |
132.92 |
128.04 - 132.92 |
0.7456 times |
Fri 27 June 2025 |
132.80 (9.01%) |
122.90 |
122.46 - 134.59 |
1.4601 times |
Fri 20 June 2025 |
121.82 (6.41%) |
119.71 |
115.64 - 122.16 |
0.6865 times |
Fri 13 June 2025 |
114.48 (-4.1%) |
120.98 |
111.34 - 120.98 |
1.1058 times |
Fri 06 June 2025 |
119.37 (7.11%) |
110.56 |
105.50 - 119.70 |
1.8735 times |
Fri 30 May 2025 |
111.45 (0.51%) |
111.52 |
110.17 - 116.32 |
0.8462 times |
Fri 23 May 2025 |
110.88 (-6.71%) |
117.04 |
103.99 - 122.15 |
1.4761 times |
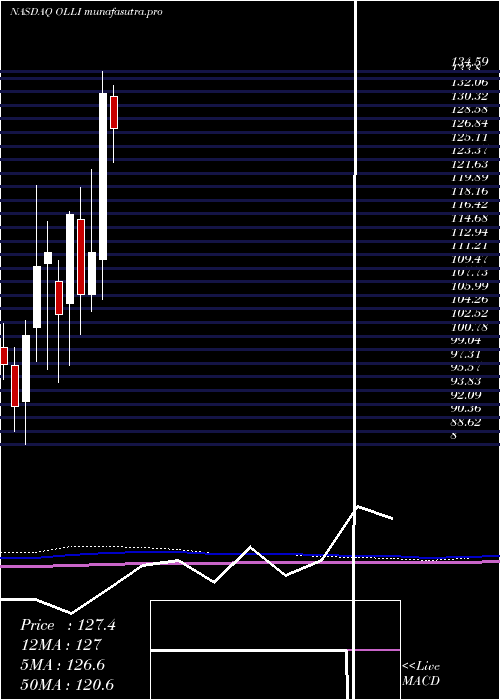
Monthly price and charts OllieS Strong monthly Stock price targets for OllieS OLLI are 134.15 and 142.05 | Monthly Target 1 | 127.59 | | Monthly Target 2 | 132.81 | | Monthly Target 3 | 135.48666666667 | | Monthly Target 4 | 140.71 | | Monthly Target 5 | 143.39 |
Monthly price and volumes Ollie S
| Date |
Closing |
Open |
Range |
Volume |
Fri 01 August 2025 |
138.04 (1.03%) |
133.71 |
130.26 - 138.16 |
0.0308 times |
Thu 31 July 2025 |
136.63 (3.68%) |
131.50 |
122.94 - 140.25 |
0.9181 times |
Mon 30 June 2025 |
131.78 (18.24%) |
110.56 |
105.50 - 134.59 |
1.3643 times |
Fri 30 May 2025 |
111.45 (5.03%) |
106.17 |
103.99 - 122.15 |
1.2029 times |
Wed 30 April 2025 |
106.11 (-8.81%) |
115.74 |
100.94 - 119.76 |
1.4374 times |
Mon 31 March 2025 |
116.36 (12.41%) |
104.98 |
97.04 - 116.79 |
1.1757 times |
Fri 28 February 2025 |
103.51 (-7.17%) |
107.73 |
94.88 - 110.48 |
0.8001 times |
Fri 31 January 2025 |
111.51 (1.62%) |
110.12 |
96.52 - 115.42 |
1.0686 times |
Tue 31 December 2024 |
109.73 (8.75%) |
101.86 |
97.50 - 120.03 |
1.0516 times |
Tue 26 November 2024 |
100.90 (9.88%) |
92.45 |
86.88 - 102.83 |
0.9505 times |
Thu 31 October 2024 |
91.83 (-5.52%) |
97.02 |
88.60 - 99.27 |
1.0174 times |
DMA SMA EMA moving averages of Ollie S OLLI
DMA (daily moving average) of Ollie S OLLI
| DMA period | DMA value | | 5 day DMA | 138.08 | | 12 day DMA | 135.16 | | 20 day DMA | 131.85 | | 35 day DMA | 129.03 | | 50 day DMA | 124.49 | | 100 day DMA | 117 | | 150 day DMA | 113.46 | | 200 day DMA | 109.74 | EMA (exponential moving average) of Ollie S OLLI
| EMA period | EMA current | EMA prev | EMA prev2 | | 5 day EMA | 137.16 | 136.72 | 136.77 | | 12 day EMA | 135.02 | 134.47 | 134.08 | | 20 day EMA | 132.86 | 132.31 | 131.85 | | 35 day EMA | 128.7 | 128.15 | 127.65 | | 50 day EMA | 125.16 | 124.63 | 124.14 |
SMA (simple moving average) of Ollie S OLLI
| SMA period | SMA current | SMA prev | SMA prev2 | | 5 day SMA | 138.08 | 137.22 | 136.24 | | 12 day SMA | 135.16 | 134.27 | 133.14 | | 20 day SMA | 131.85 | 131.49 | 131.17 | | 35 day SMA | 129.03 | 128.31 | 127.72 | | 50 day SMA | 124.49 | 124.14 | 123.79 | | 100 day SMA | 117 | 116.65 | 116.33 | | 150 day SMA | 113.46 | 113.33 | 113.2 | | 200 day SMA | 109.74 | 109.54 | 109.33 |
|
|
