OfsCredit OCCI full analysis,charts,indicators,moving averages,SMA,DMA,EMA,ADX,MACD,RSIOfs Credit OCCI WideScreen charts, DMA,SMA,EMA technical analysis, forecast prediction, by indicators ADX,MACD,RSI,CCI NASDAQ stock exchange
operates under N A sector & deals in N A
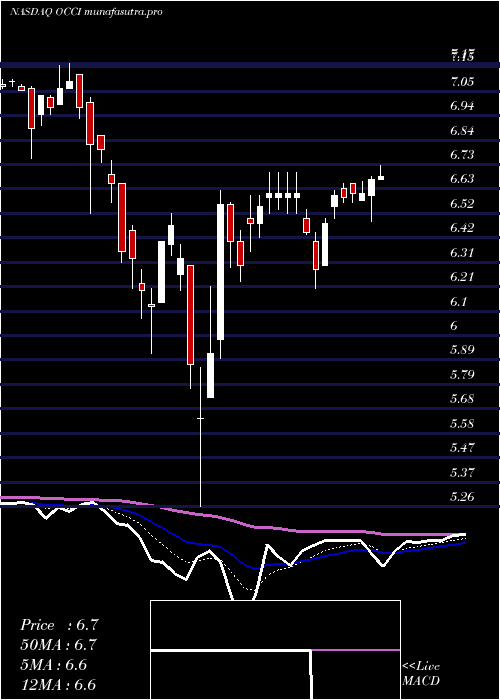
Daily price and charts and targets OfsCredit Strong Daily Stock price targets for OfsCredit OCCI are 6.21 and 6.26 | Daily Target 1 | 6.19 | | Daily Target 2 | 6.22 | | Daily Target 3 | 6.2433333333333 | | Daily Target 4 | 6.27 | | Daily Target 5 | 6.29 |
Daily price and volume Ofs Credit
| Date |
Closing |
Open |
Range |
Volume |
Mon 14 July 2025 |
6.24 (-0.48%) |
6.27 |
6.22 - 6.27 |
1.1314 times |
Fri 11 July 2025 |
6.27 (-0.48%) |
6.29 |
6.21 - 6.29 |
0.7021 times |
Thu 10 July 2025 |
6.30 (0.8%) |
6.28 |
6.25 - 6.30 |
0.8486 times |
Wed 09 July 2025 |
6.25 (-0.16%) |
6.27 |
6.21 - 6.29 |
1.4427 times |
Tue 08 July 2025 |
6.26 (0%) |
6.26 |
6.24 - 6.28 |
0.6618 times |
Mon 07 July 2025 |
6.26 (-0.16%) |
6.25 |
6.23 - 6.29 |
0.9897 times |
Thu 03 July 2025 |
6.27 (1.13%) |
6.21 |
6.21 - 6.30 |
1.0407 times |
Wed 02 July 2025 |
6.20 (-0.48%) |
6.20 |
6.20 - 6.24 |
0.9476 times |
Tue 01 July 2025 |
6.23 (0%) |
6.25 |
6.19 - 6.25 |
0.9666 times |
Mon 30 June 2025 |
6.23 (0.97%) |
6.18 |
6.18 - 6.28 |
1.269 times |
Fri 27 June 2025 |
6.17 (0.98%) |
6.15 |
6.11 - 6.18 |
0.7412 times |
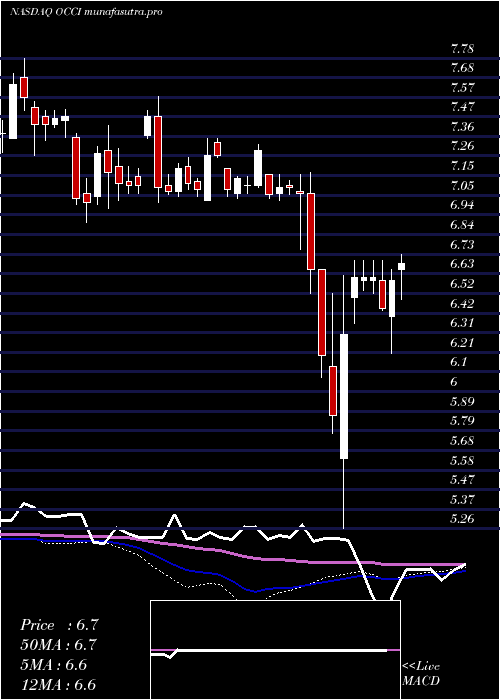
Weekly price and charts OfsCredit Strong weekly Stock price targets for OfsCredit OCCI are 6.21 and 6.26 | Weekly Target 1 | 6.19 | | Weekly Target 2 | 6.22 | | Weekly Target 3 | 6.2433333333333 | | Weekly Target 4 | 6.27 | | Weekly Target 5 | 6.29 |
Weekly price and volumes for Ofs Credit
| Date |
Closing |
Open |
Range |
Volume |
Mon 14 July 2025 |
6.24 (-0.48%) |
6.27 |
6.22 - 6.27 |
0.1655 times |
Fri 11 July 2025 |
6.27 (0%) |
6.25 |
6.21 - 6.30 |
0.6796 times |
Thu 03 July 2025 |
6.27 (1.62%) |
6.18 |
6.18 - 6.30 |
0.618 times |
Fri 27 June 2025 |
6.17 (2.66%) |
5.98 |
5.88 - 6.18 |
0.9792 times |
Fri 20 June 2025 |
6.01 (-4.75%) |
6.34 |
6.01 - 6.36 |
0.99 times |
Fri 13 June 2025 |
6.31 (4.3%) |
6.05 |
6.05 - 6.43 |
1.0697 times |
Fri 06 June 2025 |
6.05 (-2.1%) |
6.13 |
5.98 - 6.18 |
1.0596 times |
Fri 30 May 2025 |
6.18 (3.34%) |
6.03 |
5.95 - 6.19 |
0.8064 times |
Fri 23 May 2025 |
5.98 (-12.06%) |
6.70 |
5.93 - 6.82 |
2.2031 times |
Fri 16 May 2025 |
6.80 (1.64%) |
6.73 |
6.59 - 6.80 |
1.429 times |
Fri 09 May 2025 |
6.69 (-1.33%) |
6.79 |
6.60 - 6.79 |
0.685 times |
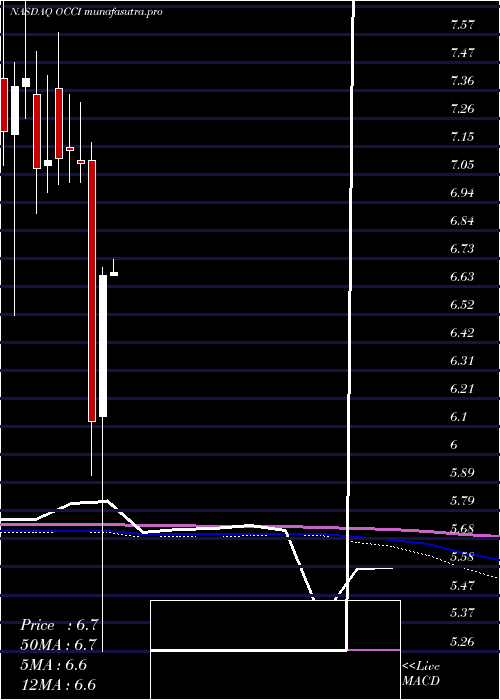
Monthly price and charts OfsCredit Strong monthly Stock price targets for OfsCredit OCCI are 6.16 and 6.27 | Monthly Target 1 | 6.13 | | Monthly Target 2 | 6.19 | | Monthly Target 3 | 6.2433333333333 | | Monthly Target 4 | 6.3 | | Monthly Target 5 | 6.35 |
Monthly price and volumes Ofs Credit
| Date |
Closing |
Open |
Range |
Volume |
Mon 14 July 2025 |
6.24 (0.16%) |
6.25 |
6.19 - 6.30 |
0.2524 times |
Mon 30 June 2025 |
6.23 (0.81%) |
6.13 |
5.88 - 6.43 |
0.8465 times |
Fri 30 May 2025 |
6.18 (-7.35%) |
6.67 |
5.93 - 6.82 |
1.0843 times |
Wed 30 April 2025 |
6.67 (8.99%) |
6.14 |
5.26 - 6.70 |
1.2674 times |
Mon 31 March 2025 |
6.12 (-13.68%) |
7.10 |
5.92 - 7.17 |
1.6043 times |
Fri 28 February 2025 |
7.09 (-0.7%) |
7.10 |
7.02 - 7.32 |
1.0391 times |
Fri 31 January 2025 |
7.14 (0.42%) |
7.15 |
7.02 - 7.35 |
0.9641 times |
Tue 31 December 2024 |
7.11 (0.14%) |
7.37 |
7.01 - 7.58 |
0.7534 times |
Tue 26 November 2024 |
7.10 (0.42%) |
7.08 |
6.98 - 7.42 |
1.0266 times |
Thu 31 October 2024 |
7.07 (-4.59%) |
7.35 |
6.90 - 7.51 |
1.1619 times |
Mon 30 September 2024 |
7.41 (0.41%) |
7.38 |
7.26 - 7.78 |
1.0804 times |
DMA SMA EMA moving averages of Ofs Credit OCCI
DMA (daily moving average) of Ofs Credit OCCI
| DMA period | DMA value | | 5 day DMA | 6.26 | | 12 day DMA | 6.23 | | 20 day DMA | 6.2 | | 35 day DMA | 6.16 | | 50 day DMA | 6.31 | | 100 day DMA | 6.5 | | 150 day DMA | 6.73 | | 200 day DMA | 6.86 | EMA (exponential moving average) of Ofs Credit OCCI
| EMA period | EMA current | EMA prev | EMA prev2 | | 5 day EMA | 6.25 | 6.26 | 6.26 | | 12 day EMA | 6.24 | 6.24 | 6.23 | | 20 day EMA | 6.22 | 6.22 | 6.22 | | 35 day EMA | 6.28 | 6.28 | 6.28 | | 50 day EMA | 6.35 | 6.35 | 6.35 |
SMA (simple moving average) of Ofs Credit OCCI
| SMA period | SMA current | SMA prev | SMA prev2 | | 5 day SMA | 6.26 | 6.27 | 6.27 | | 12 day SMA | 6.23 | 6.22 | 6.2 | | 20 day SMA | 6.2 | 6.21 | 6.21 | | 35 day SMA | 6.16 | 6.17 | 6.18 | | 50 day SMA | 6.31 | 6.32 | 6.33 | | 100 day SMA | 6.5 | 6.51 | 6.52 | | 150 day SMA | 6.73 | 6.73 | 6.74 | | 200 day SMA | 6.86 | 6.87 | 6.88 |
|
|
