NewYork NYMTM full analysis,charts,indicators,moving averages,SMA,DMA,EMA,ADX,MACD,RSINew York NYMTM WideScreen charts, DMA,SMA,EMA technical analysis, forecast prediction, by indicators ADX,MACD,RSI,CCI NASDAQ stock exchange
Daily price and charts and targets NewYork Strong Daily Stock price targets for NewYork NYMTM are 24.88 and 25.11 | Daily Target 1 | 24.69 | | Daily Target 2 | 24.83 | | Daily Target 3 | 24.916666666667 | | Daily Target 4 | 25.06 | | Daily Target 5 | 25.15 |
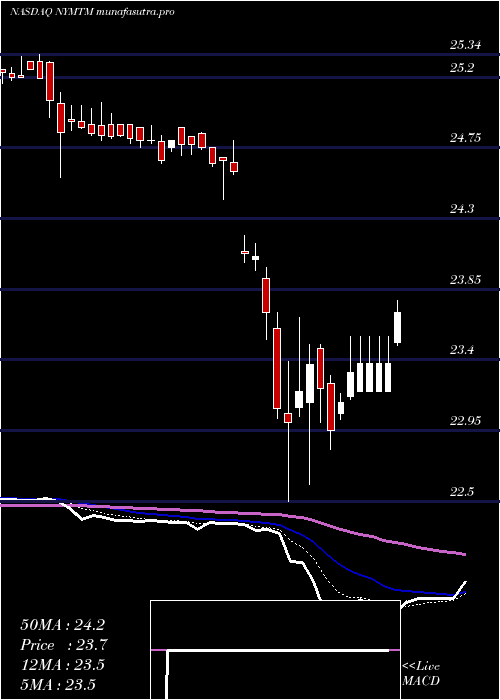
Daily price and volume New York
| Date |
Closing |
Open |
Range |
Volume |
Tue 02 September 2025 |
24.98 (0.81%) |
24.77 |
24.77 - 25.00 |
1.6964 times |
Fri 29 August 2025 |
24.78 (0%) |
24.95 |
24.78 - 24.95 |
0.9684 times |
Fri 29 August 2025 |
24.78 (-0.68%) |
24.95 |
24.78 - 24.95 |
0.9684 times |
Thu 28 August 2025 |
24.95 (0.2%) |
24.95 |
24.91 - 24.95 |
2.6786 times |
Wed 27 August 2025 |
24.90 (0.32%) |
24.80 |
24.80 - 24.90 |
0.7898 times |
Tue 26 August 2025 |
24.82 (-0.12%) |
24.87 |
24.81 - 24.87 |
0.3434 times |
Mon 25 August 2025 |
24.85 (-0.16%) |
24.82 |
24.79 - 24.89 |
0.8379 times |
Fri 22 August 2025 |
24.89 (0.04%) |
24.78 |
24.78 - 24.90 |
0.6731 times |
Thu 21 August 2025 |
24.88 (0.36%) |
24.81 |
24.78 - 24.88 |
0.2266 times |
Wed 20 August 2025 |
24.79 (0.08%) |
24.76 |
24.76 - 24.79 |
0.8173 times |
Tue 19 August 2025 |
24.77 (0.08%) |
24.78 |
24.75 - 24.78 |
0.2816 times |
Weekly price and charts NewYork Strong weekly Stock price targets for NewYork NYMTM are 24.88 and 25.11 | Weekly Target 1 | 24.69 | | Weekly Target 2 | 24.83 | | Weekly Target 3 | 24.916666666667 | | Weekly Target 4 | 25.06 | | Weekly Target 5 | 25.15 |
Weekly price and volumes for New York
| Date |
Closing |
Open |
Range |
Volume |
Tue 02 September 2025 |
24.98 (0.81%) |
24.77 |
24.77 - 25.00 |
0.4266 times |
Fri 29 August 2025 |
24.78 (0%) |
24.95 |
24.78 - 24.95 |
0.2435 times |
Fri 29 August 2025 |
24.78 (-0.44%) |
24.82 |
24.78 - 24.95 |
1.4127 times |
Fri 22 August 2025 |
24.89 (0.44%) |
24.78 |
24.75 - 24.90 |
0.7271 times |
Fri 15 August 2025 |
24.78 (0.12%) |
24.76 |
24.62 - 24.78 |
0.9291 times |
Fri 08 August 2025 |
24.75 (0.2%) |
24.77 |
24.67 - 24.86 |
1.0224 times |
Fri 01 August 2025 |
24.70 (0.41%) |
24.62 |
24.55 - 24.76 |
1.67 times |
Fri 25 July 2025 |
24.60 (0.08%) |
24.59 |
24.52 - 24.71 |
0.8411 times |
Fri 18 July 2025 |
24.58 (-0.53%) |
24.51 |
24.30 - 24.65 |
1.2457 times |
Fri 11 July 2025 |
24.71 (1.6%) |
24.32 |
24.27 - 24.80 |
1.4818 times |
Thu 03 July 2025 |
24.32 (-1.58%) |
24.71 |
24.09 - 24.78 |
4.3745 times |

Monthly price and charts NewYork Strong monthly Stock price targets for NewYork NYMTM are 24.88 and 25.11 | Monthly Target 1 | 24.69 | | Monthly Target 2 | 24.83 | | Monthly Target 3 | 24.916666666667 | | Monthly Target 4 | 25.06 | | Monthly Target 5 | 25.15 |
Monthly price and volumes New York
| Date |
Closing |
Open |
Range |
Volume |
Tue 02 September 2025 |
24.98 (0.81%) |
24.77 |
24.77 - 25.00 |
0.065 times |
Fri 29 August 2025 |
24.78 (0.08%) |
24.68 |
24.62 - 24.95 |
0.6766 times |
Thu 31 July 2025 |
24.76 (0.86%) |
24.15 |
24.09 - 24.80 |
0.9762 times |
Mon 30 June 2025 |
24.55 (0.49%) |
24.43 |
24.22 - 24.80 |
1.257 times |
Fri 30 May 2025 |
24.43 (-0.73%) |
24.70 |
24.09 - 24.92 |
0.8427 times |
Wed 30 April 2025 |
24.61 (0.04%) |
24.09 |
22.50 - 24.65 |
1.9362 times |
Mon 31 March 2025 |
24.60 (-2.34%) |
25.29 |
24.42 - 25.30 |
1.9871 times |
Fri 28 February 2025 |
25.19 (0.16%) |
25.19 |
25.13 - 25.39 |
0.4382 times |
Fri 31 January 2025 |
25.15 (1.58%) |
24.80 |
24.76 - 25.36 |
1.0307 times |
Tue 31 December 2024 |
24.76 (-0.6%) |
25.04 |
24.71 - 25.28 |
0.7902 times |
Tue 26 November 2024 |
24.91 (-0.08%) |
24.91 |
24.41 - 25.18 |
0.8972 times |

DMA SMA EMA moving averages of New York NYMTM
DMA (daily moving average) of New York NYMTM
| DMA period | DMA value | | 5 day DMA | 24.88 | | 12 day DMA | 24.85 | | 20 day DMA | 24.81 | | 35 day DMA | 24.73 | | 50 day DMA | 24.68 | | 100 day DMA | 24.48 | | 150 day DMA | 24.6 | | 200 day DMA | 24.7 | EMA (exponential moving average) of New York NYMTM
| EMA period | EMA current | EMA prev | EMA prev2 | | 5 day EMA | 24.88 | 24.83 | 24.85 | | 12 day EMA | 24.84 | 24.82 | 24.83 | | 20 day EMA | 24.82 | 24.8 | 24.8 | | 35 day EMA | 24.77 | 24.76 | 24.76 | | 50 day EMA | 24.7 | 24.69 | 24.69 |
SMA (simple moving average) of New York NYMTM
| SMA period | SMA current | SMA prev | SMA prev2 | | 5 day SMA | 24.88 | 24.85 | 24.86 | | 12 day SMA | 24.85 | 24.83 | 24.83 | | 20 day SMA | 24.81 | 24.8 | 24.79 | | 35 day SMA | 24.73 | 24.72 | 24.72 | | 50 day SMA | 24.68 | 24.68 | 24.68 | | 100 day SMA | 24.48 | 24.47 | 24.45 | | 150 day SMA | 24.6 | 24.6 | 24.6 | | 200 day SMA | 24.7 | 24.7 | 24.7 |
|
|
