NasdaqSmartphone NXTG full analysis,charts,indicators,moving averages,SMA,DMA,EMA,ADX,MACD,RSINasdaq Smartphone NXTG WideScreen charts, DMA,SMA,EMA technical analysis, forecast prediction, by indicators ADX,MACD,RSI,CCI NASDAQ stock exchange
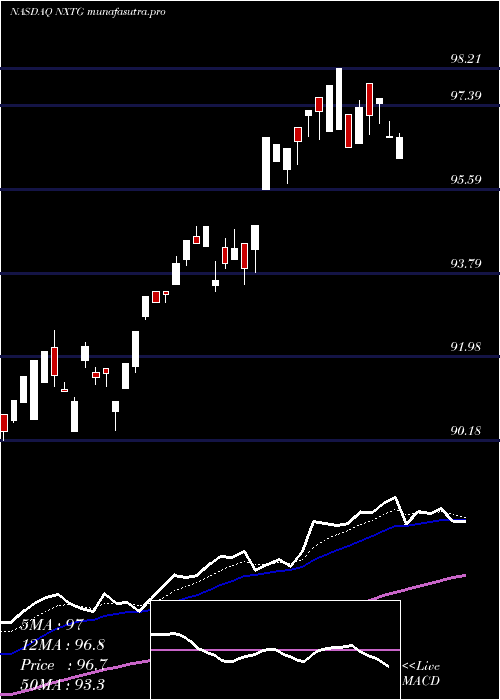
Daily price and charts and targets NasdaqSmartphone Strong Daily Stock price targets for NasdaqSmartphone NXTG are 97.17 and 97.56 | Daily Target 1 | 96.86 | | Daily Target 2 | 97.08 | | Daily Target 3 | 97.25 | | Daily Target 4 | 97.47 | | Daily Target 5 | 97.64 |
Daily price and volume Nasdaq Smartphone
| Date |
Closing |
Open |
Range |
Volume |
Tue 29 July 2025 |
97.30 (0.2%) |
97.17 |
97.03 - 97.42 |
3.883 times |
Mon 28 July 2025 |
97.11 (-0.51%) |
97.14 |
96.89 - 97.14 |
0.3837 times |
Fri 25 July 2025 |
97.61 (-0.24%) |
97.44 |
97.37 - 97.61 |
0.399 times |
Thu 24 July 2025 |
97.84 (-0.52%) |
97.84 |
97.77 - 98.05 |
0.2302 times |
Wed 23 July 2025 |
98.35 (0.63%) |
97.81 |
97.79 - 98.37 |
0.5986 times |
Tue 22 July 2025 |
97.73 (-0.19%) |
97.11 |
97.11 - 97.73 |
0.6753 times |
Mon 21 July 2025 |
97.92 (0.35%) |
97.95 |
97.92 - 98.45 |
0.6446 times |
Fri 18 July 2025 |
97.58 (-0.09%) |
97.51 |
97.44 - 97.70 |
0.4221 times |
Thu 17 July 2025 |
97.67 (0.73%) |
97.14 |
97.14 - 97.77 |
2.4412 times |
Wed 16 July 2025 |
96.96 (0.42%) |
96.22 |
96.19 - 96.96 |
0.3223 times |
Tue 15 July 2025 |
96.55 (-0.18%) |
97.50 |
96.34 - 97.50 |
0.706 times |
Weekly price and charts NasdaqSmartphone Strong weekly Stock price targets for NasdaqSmartphone NXTG are 97.1 and 97.63 | Weekly Target 1 | 96.67 | | Weekly Target 2 | 96.99 | | Weekly Target 3 | 97.203333333333 | | Weekly Target 4 | 97.52 | | Weekly Target 5 | 97.73 |
Weekly price and volumes for Nasdaq Smartphone
| Date |
Closing |
Open |
Range |
Volume |
Tue 29 July 2025 |
97.30 (-0.32%) |
97.14 |
96.89 - 97.42 |
1.1985 times |
Fri 25 July 2025 |
97.61 (0.03%) |
97.95 |
97.11 - 98.45 |
0.7157 times |
Fri 18 July 2025 |
97.58 (0.87%) |
96.26 |
96.19 - 97.77 |
1.1966 times |
Fri 11 July 2025 |
96.74 (-1.5%) |
97.20 |
96.49 - 97.88 |
2.4401 times |
Thu 03 July 2025 |
98.21 (1.66%) |
97.18 |
96.66 - 98.21 |
0.5863 times |
Fri 27 June 2025 |
96.61 (2.9%) |
94.30 |
93.80 - 96.92 |
1.4787 times |
Fri 20 June 2025 |
93.89 (0.28%) |
94.33 |
93.55 - 94.73 |
0.3535 times |
Fri 13 June 2025 |
93.63 (0.33%) |
93.55 |
93.38 - 94.79 |
0.6208 times |
Fri 06 June 2025 |
93.32 (2.54%) |
91.31 |
91.30 - 93.40 |
0.6639 times |
Fri 30 May 2025 |
91.01 (0%) |
91.90 |
90.39 - 92.29 |
0.7458 times |
Fri 23 May 2025 |
91.01 (-0.59%) |
90.64 |
90.37 - 92.55 |
1.2287 times |
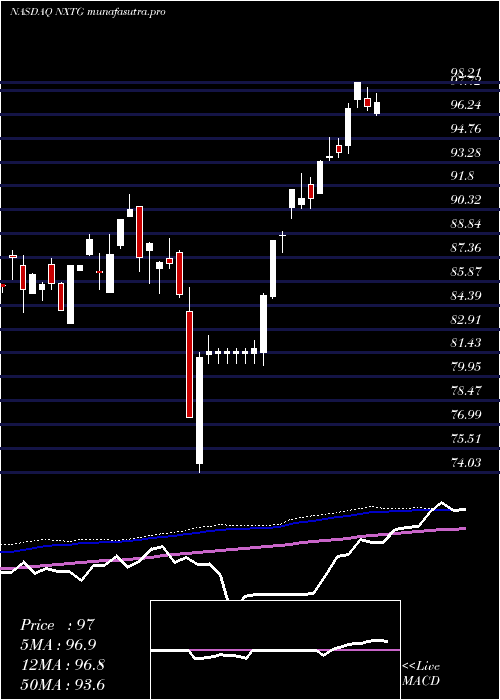
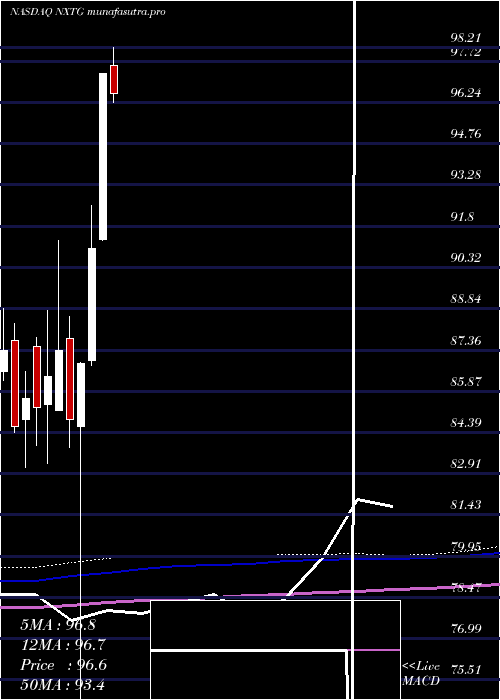
Monthly price and charts NasdaqSmartphone Strong monthly Stock price targets for NasdaqSmartphone NXTG are 95.62 and 97.88 | Monthly Target 1 | 95.05 | | Monthly Target 2 | 96.18 | | Monthly Target 3 | 97.313333333333 | | Monthly Target 4 | 98.44 | | Monthly Target 5 | 99.57 |
Monthly price and volumes Nasdaq Smartphone
| Date |
Closing |
Open |
Range |
Volume |
Tue 29 July 2025 |
97.30 (0.01%) |
97.57 |
96.19 - 98.45 |
0.9166 times |
Mon 30 June 2025 |
97.29 (6.9%) |
91.31 |
91.30 - 97.29 |
0.52 times |
Fri 30 May 2025 |
91.01 (4.77%) |
86.97 |
86.81 - 92.55 |
0.7181 times |
Wed 30 April 2025 |
86.87 (2.37%) |
84.61 |
74.03 - 86.89 |
0.8584 times |
Mon 31 March 2025 |
84.86 (-2.84%) |
87.76 |
83.87 - 88.54 |
1.4343 times |
Fri 28 February 2025 |
87.34 (1.08%) |
85.17 |
85.17 - 91.29 |
1.4182 times |
Fri 31 January 2025 |
86.41 (1.31%) |
85.41 |
83.27 - 88.78 |
1.2502 times |
Tue 31 December 2024 |
85.29 (-0.36%) |
87.47 |
83.92 - 87.80 |
1.2269 times |
Tue 26 November 2024 |
85.60 (1.18%) |
84.85 |
83.15 - 86.59 |
0.7797 times |
Thu 31 October 2024 |
84.60 (-3.14%) |
87.68 |
84.41 - 88.30 |
0.8774 times |
Mon 30 September 2024 |
87.34 (1.35%) |
85.68 |
82.69 - 88.84 |
0.7263 times |
DMA SMA EMA moving averages of Nasdaq Smartphone NXTG
DMA (daily moving average) of Nasdaq Smartphone NXTG
| DMA period | DMA value | | 5 day DMA | 97.64 | | 12 day DMA | 97.45 | | 20 day DMA | 97.4 | | 35 day DMA | 96.38 | | 50 day DMA | 95.02 | | 100 day DMA | 89.91 | | 150 day DMA | 89.03 | | 200 day DMA | 88.29 | EMA (exponential moving average) of Nasdaq Smartphone NXTG
| EMA period | EMA current | EMA prev | EMA prev2 | | 5 day EMA | 97.46 | 97.54 | 97.76 | | 12 day EMA | 97.42 | 97.44 | 97.5 | | 20 day EMA | 97.06 | 97.04 | 97.03 | | 35 day EMA | 95.98 | 95.9 | 95.83 | | 50 day EMA | 94.83 | 94.73 | 94.63 |
SMA (simple moving average) of Nasdaq Smartphone NXTG
| SMA period | SMA current | SMA prev | SMA prev2 | | 5 day SMA | 97.64 | 97.73 | 97.89 | | 12 day SMA | 97.45 | 97.4 | 97.44 | | 20 day SMA | 97.4 | 97.4 | 97.37 | | 35 day SMA | 96.38 | 96.26 | 96.15 | | 50 day SMA | 95.02 | 94.88 | 94.75 | | 100 day SMA | 89.91 | 89.81 | 89.72 | | 150 day SMA | 89.03 | 88.95 | 88.88 | | 200 day SMA | 88.29 | 88.23 | 88.18 |
|
|
