NewellBrands NWL full analysis,charts,indicators,moving averages,SMA,DMA,EMA,ADX,MACD,RSINewell Brands NWL WideScreen charts, DMA,SMA,EMA technical analysis, forecast prediction, by indicators ADX,MACD,RSI,CCI NASDAQ stock exchange
operates under Consumer Non Durables sector & deals in Plastic Products
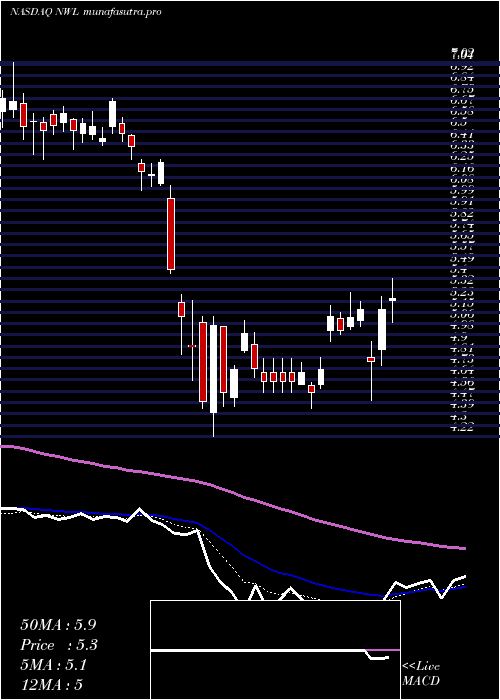
Daily price and charts and targets NewellBrands Strong Daily Stock price targets for NewellBrands NWL are 3.7 and 3.82 | Daily Target 1 | 3.61 | | Daily Target 2 | 3.67 | | Daily Target 3 | 3.7333333333333 | | Daily Target 4 | 3.79 | | Daily Target 5 | 3.85 |
Daily price and volume Newell Brands
| Date |
Closing |
Open |
Range |
Volume |
Fri 05 December 2025 |
3.72 (0.81%) |
3.70 |
3.68 - 3.80 |
0.79 times |
Thu 04 December 2025 |
3.69 (-1.86%) |
3.77 |
3.65 - 3.79 |
0.5708 times |
Wed 03 December 2025 |
3.76 (2.17%) |
3.70 |
3.70 - 3.89 |
0.9812 times |
Tue 02 December 2025 |
3.68 (-3.41%) |
3.82 |
3.67 - 3.88 |
0.6867 times |
Mon 01 December 2025 |
3.81 (4.38%) |
3.55 |
3.55 - 3.94 |
1.2128 times |
Fri 28 November 2025 |
3.65 (1.96%) |
3.50 |
3.50 - 3.65 |
0.6052 times |
Wed 26 November 2025 |
3.58 (3.17%) |
3.47 |
3.42 - 3.64 |
0.8119 times |
Tue 25 November 2025 |
3.47 (0.58%) |
3.47 |
3.46 - 3.62 |
0.7149 times |
Mon 24 November 2025 |
3.45 (3.29%) |
3.35 |
3.29 - 3.49 |
1.8227 times |
Fri 21 November 2025 |
3.34 (3.41%) |
3.25 |
3.22 - 3.40 |
1.8038 times |
Thu 20 November 2025 |
3.23 (-2.12%) |
3.31 |
3.21 - 3.37 |
0.6857 times |
Weekly price and charts NewellBrands Strong weekly Stock price targets for NewellBrands NWL are 3.64 and 4.03 | Weekly Target 1 | 3.35 | | Weekly Target 2 | 3.53 | | Weekly Target 3 | 3.7366666666667 | | Weekly Target 4 | 3.92 | | Weekly Target 5 | 4.13 |
Weekly price and volumes for Newell Brands
| Date |
Closing |
Open |
Range |
Volume |
Fri 05 December 2025 |
3.72 (1.92%) |
3.55 |
3.55 - 3.94 |
0.7628 times |
Fri 28 November 2025 |
3.65 (9.28%) |
3.35 |
3.29 - 3.65 |
0.7112 times |
Fri 21 November 2025 |
3.34 (-2.34%) |
3.42 |
3.21 - 3.49 |
0.8886 times |
Fri 14 November 2025 |
3.42 (7.55%) |
3.25 |
3.21 - 3.51 |
1.2545 times |
Fri 07 November 2025 |
3.18 (-6.47%) |
3.16 |
3.07 - 3.34 |
0.9507 times |
Fri 31 October 2025 |
3.40 (0%) |
3.76 |
3.09 - 3.80 |
1.4193 times |
Fri 31 October 2025 |
3.40 (-31.73%) |
5.00 |
3.09 - 5.14 |
2.0201 times |
Fri 24 October 2025 |
4.98 (2.68%) |
4.87 |
4.78 - 5.04 |
0.4565 times |
Fri 17 October 2025 |
4.85 (0.21%) |
4.97 |
4.72 - 5.00 |
0.799 times |
Fri 10 October 2025 |
4.84 (-10.2%) |
5.47 |
4.83 - 5.51 |
0.7374 times |
Fri 03 October 2025 |
5.39 (4.26%) |
5.26 |
4.93 - 5.56 |
0.8183 times |

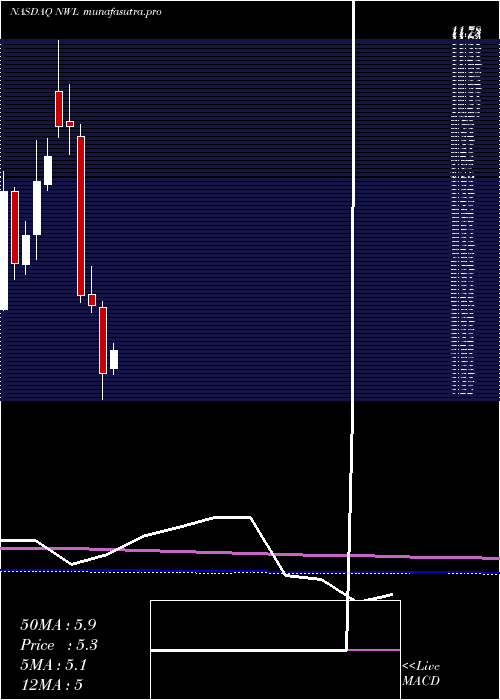
Monthly price and charts NewellBrands Strong monthly Stock price targets for NewellBrands NWL are 3.64 and 4.03 | Monthly Target 1 | 3.35 | | Monthly Target 2 | 3.53 | | Monthly Target 3 | 3.7366666666667 | | Monthly Target 4 | 3.92 | | Monthly Target 5 | 4.13 |
Monthly price and volumes Newell Brands
| Date |
Closing |
Open |
Range |
Volume |
Fri 05 December 2025 |
3.72 (1.92%) |
3.55 |
3.55 - 3.94 |
0.2099 times |
Fri 28 November 2025 |
3.65 (7.35%) |
3.16 |
3.07 - 3.65 |
1.0471 times |
Fri 31 October 2025 |
3.40 (-35.11%) |
5.26 |
3.09 - 5.56 |
1.5998 times |
Tue 30 September 2025 |
5.24 (-11.49%) |
5.80 |
4.93 - 6.64 |
0.9084 times |
Fri 29 August 2025 |
5.92 (5.53%) |
5.13 |
4.58 - 6.06 |
0.9789 times |
Thu 31 July 2025 |
5.61 (3.89%) |
5.38 |
5.33 - 6.38 |
0.8782 times |
Mon 30 June 2025 |
5.40 (1.89%) |
5.27 |
4.94 - 5.79 |
1.1439 times |
Fri 30 May 2025 |
5.30 (10.88%) |
4.87 |
4.75 - 6.13 |
1.167 times |
Wed 30 April 2025 |
4.78 (-22.9%) |
6.17 |
4.22 - 6.29 |
1.1646 times |
Mon 31 March 2025 |
6.20 (-3.43%) |
6.44 |
6.06 - 7.02 |
0.9021 times |
Fri 28 February 2025 |
6.42 (-35.54%) |
9.76 |
6.26 - 10.01 |
1.4238 times |
DMA SMA EMA moving averages of Newell Brands NWL
DMA (daily moving average) of Newell Brands NWL
| DMA period | DMA value | | 5 day DMA | 3.73 | | 12 day DMA | 3.56 | | 20 day DMA | 3.46 | | 35 day DMA | 3.85 | | 50 day DMA | 4.21 | | 100 day DMA | 4.96 | | 150 day DMA | 5.14 | | 200 day DMA | 5.3 | EMA (exponential moving average) of Newell Brands NWL
| EMA period | EMA current | EMA prev | EMA prev2 | | 5 day EMA | 3.69 | 3.68 | 3.68 | | 12 day EMA | 3.62 | 3.6 | 3.58 | | 20 day EMA | 3.65 | 3.64 | 3.64 | | 35 day EMA | 3.92 | 3.93 | 3.94 | | 50 day EMA | 4.27 | 4.29 | 4.31 |
SMA (simple moving average) of Newell Brands NWL
| SMA period | SMA current | SMA prev | SMA prev2 | | 5 day SMA | 3.73 | 3.72 | 3.7 | | 12 day SMA | 3.56 | 3.52 | 3.49 | | 20 day SMA | 3.46 | 3.43 | 3.41 | | 35 day SMA | 3.85 | 3.88 | 3.91 | | 50 day SMA | 4.21 | 4.24 | 4.27 | | 100 day SMA | 4.96 | 4.97 | 4.99 | | 150 day SMA | 5.14 | 5.15 | 5.16 | | 200 day SMA | 5.3 | 5.32 | 5.34 |
|
|
