NorthwesternCorp NWE full analysis,charts,indicators,moving averages,SMA,DMA,EMA,ADX,MACD,RSINorthwestern Corp NWE WideScreen charts, DMA,SMA,EMA technical analysis, forecast prediction, by indicators ADX,MACD,RSI,CCI NASDAQ stock exchange
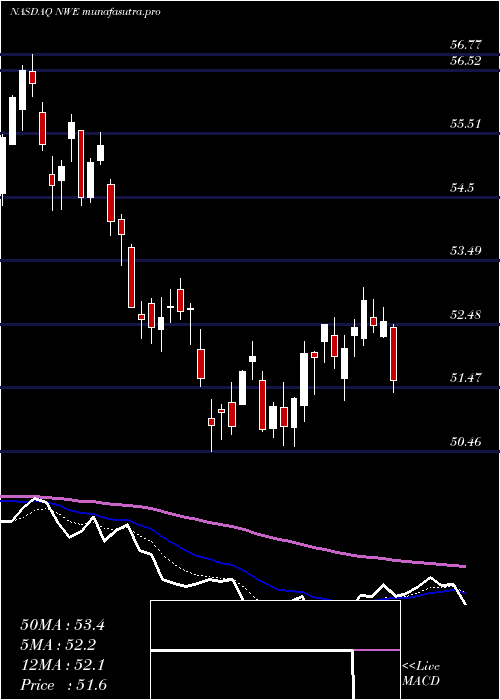
Daily price and charts and targets NorthwesternCorp Strong Daily Stock price targets for NorthwesternCorp NWE are 52.97 and 54.8 | Daily Target 1 | 51.51 | | Daily Target 2 | 52.6 | | Daily Target 3 | 53.336666666667 | | Daily Target 4 | 54.43 | | Daily Target 5 | 55.17 |
Daily price and volume Northwestern Corp
| Date |
Closing |
Open |
Range |
Volume |
Thu 31 July 2025 |
53.70 (2.07%) |
52.24 |
52.24 - 54.07 |
1.7861 times |
Wed 30 July 2025 |
52.61 (0.13%) |
52.54 |
52.20 - 53.01 |
1.8381 times |
Tue 29 July 2025 |
52.54 (0.83%) |
52.34 |
51.92 - 52.61 |
0.9674 times |
Mon 28 July 2025 |
52.11 (-0.97%) |
52.35 |
51.99 - 52.56 |
0.9073 times |
Fri 25 July 2025 |
52.62 (0.98%) |
52.20 |
52.12 - 52.64 |
0.6245 times |
Thu 24 July 2025 |
52.11 (-0.8%) |
52.21 |
51.99 - 52.46 |
0.7627 times |
Wed 23 July 2025 |
52.53 (-1.46%) |
53.54 |
52.35 - 53.54 |
0.6449 times |
Tue 22 July 2025 |
53.31 (0.7%) |
53.13 |
52.87 - 53.61 |
0.8344 times |
Mon 21 July 2025 |
52.94 (1.36%) |
52.43 |
52.43 - 53.34 |
0.8609 times |
Fri 18 July 2025 |
52.23 (0.06%) |
52.37 |
51.94 - 52.64 |
0.7736 times |
Thu 17 July 2025 |
52.20 (0.87%) |
51.50 |
51.50 - 52.28 |
2.3341 times |
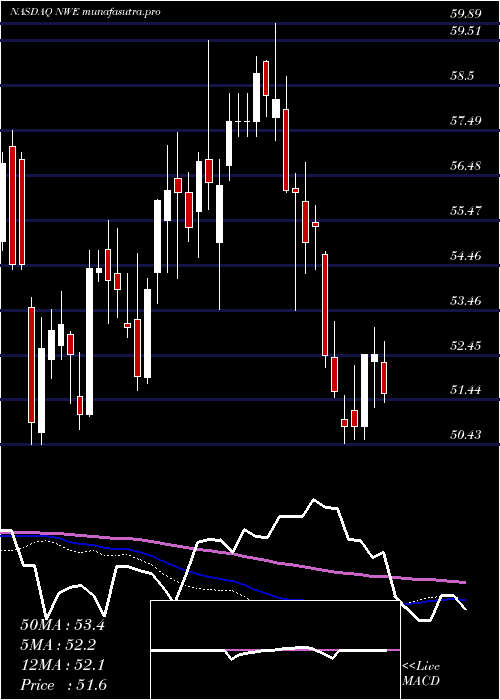
Weekly price and charts NorthwesternCorp Strong weekly Stock price targets for NorthwesternCorp NWE are 52.81 and 54.96 | Weekly Target 1 | 51.08 | | Weekly Target 2 | 52.39 | | Weekly Target 3 | 53.23 | | Weekly Target 4 | 54.54 | | Weekly Target 5 | 55.38 |
Weekly price and volumes for Northwestern Corp
| Date |
Closing |
Open |
Range |
Volume |
Thu 31 July 2025 |
53.70 (2.05%) |
52.35 |
51.92 - 54.07 |
1.1687 times |
Fri 25 July 2025 |
52.62 (0.75%) |
52.43 |
51.99 - 53.61 |
0.7922 times |
Fri 18 July 2025 |
52.23 (-0.44%) |
52.29 |
51.31 - 52.75 |
1.2525 times |
Fri 11 July 2025 |
52.46 (-0.02%) |
52.31 |
51.27 - 53.07 |
0.9285 times |
Thu 03 July 2025 |
52.47 (3.19%) |
50.84 |
50.54 - 52.47 |
0.7964 times |
Fri 27 June 2025 |
50.85 (0%) |
51.21 |
50.55 - 52.21 |
1.4838 times |
Fri 20 June 2025 |
50.85 (-1.49%) |
50.99 |
50.46 - 51.55 |
0.8142 times |
Fri 13 June 2025 |
51.62 (-1.54%) |
52.39 |
51.50 - 53.21 |
1.0242 times |
Fri 06 June 2025 |
52.43 (-5.24%) |
54.70 |
52.18 - 54.78 |
1.0914 times |
Fri 30 May 2025 |
55.33 (0.64%) |
55.43 |
54.37 - 55.81 |
0.6482 times |
Fri 23 May 2025 |
54.98 (-1.98%) |
55.90 |
54.28 - 56.77 |
0.7594 times |
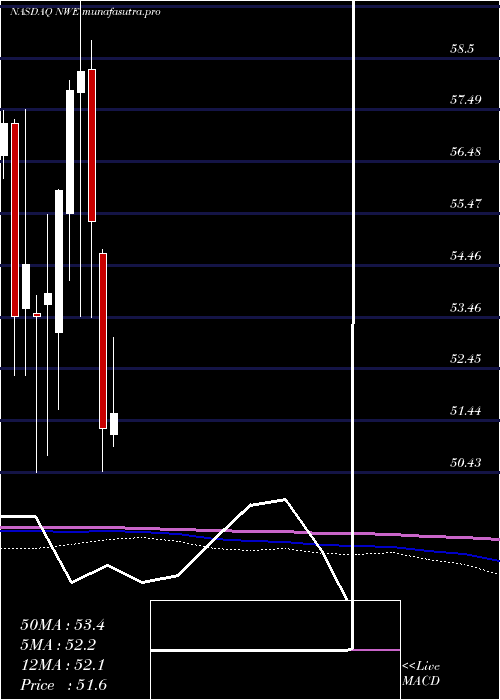
Monthly price and charts NorthwesternCorp Strong monthly Stock price targets for NorthwesternCorp NWE are 52.32 and 55.46 | Monthly Target 1 | 49.76 | | Monthly Target 2 | 51.73 | | Monthly Target 3 | 52.9 | | Monthly Target 4 | 54.87 | | Monthly Target 5 | 56.04 |
Monthly price and volumes Northwestern Corp
| Date |
Closing |
Open |
Range |
Volume |
Thu 31 July 2025 |
53.70 (4.68%) |
51.18 |
50.93 - 54.07 |
1.0523 times |
Mon 30 June 2025 |
51.30 (-7.28%) |
54.70 |
50.46 - 54.78 |
1.0142 times |
Fri 30 May 2025 |
55.33 (-4.98%) |
58.28 |
53.45 - 58.84 |
0.8269 times |
Wed 30 April 2025 |
58.23 (0.62%) |
57.84 |
53.46 - 59.89 |
1.2029 times |
Mon 31 March 2025 |
57.87 (3.47%) |
55.48 |
54.17 - 58.06 |
1.3906 times |
Fri 28 February 2025 |
55.93 (3.75%) |
53.15 |
51.66 - 55.95 |
0.9372 times |
Fri 31 January 2025 |
53.91 (0.84%) |
53.70 |
50.77 - 55.46 |
0.8085 times |
Tue 31 December 2024 |
53.46 (-1.87%) |
53.53 |
50.43 - 53.88 |
0.7449 times |
Tue 26 November 2024 |
54.48 (1.91%) |
53.62 |
52.32 - 57.49 |
0.828 times |
Thu 31 October 2024 |
53.46 (-6.57%) |
57.22 |
52.32 - 57.30 |
1.1945 times |
Mon 30 September 2024 |
57.22 (5.2%) |
54.06 |
53.94 - 57.48 |
0.7802 times |
DMA SMA EMA moving averages of Northwestern Corp NWE
DMA (daily moving average) of Northwestern Corp NWE
| DMA period | DMA value | | 5 day DMA | 52.72 | | 12 day DMA | 52.55 | | 20 day DMA | 52.45 | | 35 day DMA | 52.1 | | 50 day DMA | 52.8 | | 100 day DMA | 54.83 | | 150 day DMA | 54.46 | | 200 day DMA | 54.43 | EMA (exponential moving average) of Northwestern Corp NWE
| EMA period | EMA current | EMA prev | EMA prev2 | | 5 day EMA | 52.89 | 52.49 | 52.43 | | 12 day EMA | 52.62 | 52.42 | 52.39 | | 20 day EMA | 52.52 | 52.4 | 52.38 | | 35 day EMA | 52.78 | 52.73 | 52.74 | | 50 day EMA | 52.99 | 52.96 | 52.97 |
SMA (simple moving average) of Northwestern Corp NWE
| SMA period | SMA current | SMA prev | SMA prev2 | | 5 day SMA | 52.72 | 52.4 | 52.38 | | 12 day SMA | 52.55 | 52.38 | 52.37 | | 20 day SMA | 52.45 | 52.36 | 52.34 | | 35 day SMA | 52.1 | 52.07 | 52.06 | | 50 day SMA | 52.8 | 52.85 | 52.91 | | 100 day SMA | 54.83 | 54.85 | 54.87 | | 150 day SMA | 54.46 | 54.45 | 54.45 | | 200 day SMA | 54.43 | 54.44 | 54.46 |
|
|
