NorthwestBancshares NWBI full analysis,charts,indicators,moving averages,SMA,DMA,EMA,ADX,MACD,RSINorthwest Bancshares NWBI WideScreen charts, DMA,SMA,EMA technical analysis, forecast prediction, by indicators ADX,MACD,RSI,CCI NASDAQ stock exchange
operates under Finance sector & deals in Major Banks
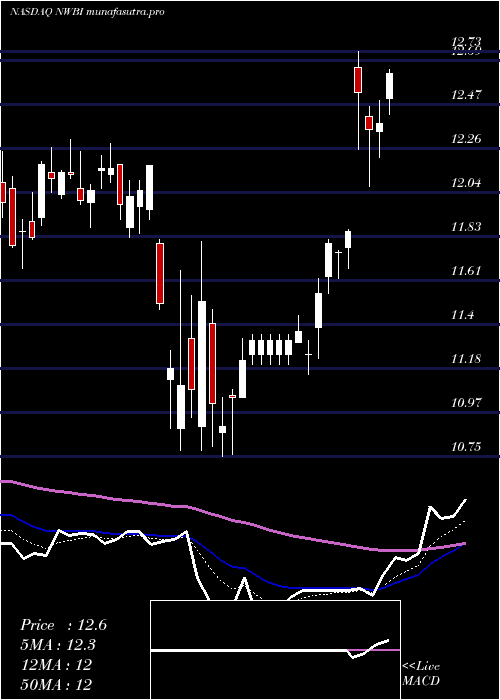
Daily price and charts and targets NorthwestBancshares Strong Daily Stock price targets for NorthwestBancshares NWBI are 12.07 and 12.24 | Daily Target 1 | 12.04 | | Daily Target 2 | 12.1 | | Daily Target 3 | 12.206666666667 | | Daily Target 4 | 12.27 | | Daily Target 5 | 12.38 |
Daily price and volume Northwest Bancshares
| Date |
Closing |
Open |
Range |
Volume |
Fri 05 December 2025 |
12.17 (-1.38%) |
12.25 |
12.14 - 12.31 |
0.647 times |
Thu 04 December 2025 |
12.34 (-1.04%) |
12.42 |
12.32 - 12.48 |
0.7751 times |
Wed 03 December 2025 |
12.47 (1.71%) |
12.33 |
12.27 - 12.54 |
0.9979 times |
Tue 02 December 2025 |
12.26 (1.83%) |
12.09 |
11.99 - 12.27 |
1.293 times |
Mon 01 December 2025 |
12.04 (0.67%) |
11.86 |
11.86 - 12.12 |
0.6663 times |
Fri 28 November 2025 |
11.96 (-0.66%) |
12.01 |
11.93 - 12.05 |
0.5869 times |
Wed 26 November 2025 |
12.04 (-1.07%) |
12.09 |
12.03 - 12.20 |
1.6891 times |
Tue 25 November 2025 |
12.17 (3.66%) |
11.82 |
11.82 - 12.28 |
1.3309 times |
Mon 24 November 2025 |
11.74 (-0.17%) |
11.76 |
11.67 - 11.82 |
0.8108 times |
Fri 21 November 2025 |
11.76 (4.07%) |
11.35 |
11.34 - 11.86 |
1.2029 times |
Thu 20 November 2025 |
11.30 (-0.35%) |
11.44 |
11.28 - 11.57 |
0.7231 times |
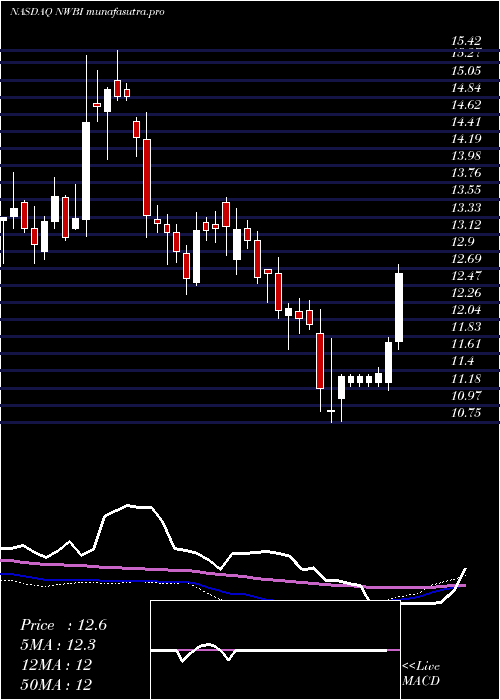
Weekly price and charts NorthwestBancshares Strong weekly Stock price targets for NorthwestBancshares NWBI are 12.02 and 12.7 | Weekly Target 1 | 11.51 | | Weekly Target 2 | 11.84 | | Weekly Target 3 | 12.19 | | Weekly Target 4 | 12.52 | | Weekly Target 5 | 12.87 |
Weekly price and volumes for Northwest Bancshares
| Date |
Closing |
Open |
Range |
Volume |
Fri 05 December 2025 |
12.17 (1.76%) |
11.86 |
11.86 - 12.54 |
1.0678 times |
Fri 28 November 2025 |
11.96 (1.7%) |
11.76 |
11.67 - 12.28 |
1.0771 times |
Fri 21 November 2025 |
11.76 (-0.08%) |
11.74 |
11.25 - 11.86 |
1.1917 times |
Fri 14 November 2025 |
11.77 (0.43%) |
11.73 |
11.58 - 11.99 |
0.9051 times |
Fri 07 November 2025 |
11.72 (0.09%) |
11.83 |
11.57 - 12.05 |
0.8305 times |
Fri 31 October 2025 |
11.71 (0%) |
11.69 |
11.64 - 11.80 |
0.2384 times |
Fri 31 October 2025 |
11.71 (-6.84%) |
12.56 |
11.61 - 12.62 |
1.7783 times |
Fri 24 October 2025 |
12.57 (3.88%) |
12.14 |
12.07 - 12.60 |
0.7572 times |
Fri 17 October 2025 |
12.10 (0.08%) |
12.15 |
11.77 - 12.75 |
1.0262 times |
Fri 10 October 2025 |
12.09 (-3.05%) |
12.55 |
12.09 - 12.80 |
1.1276 times |
Fri 03 October 2025 |
12.47 (-0.4%) |
12.52 |
12.24 - 12.58 |
0.763 times |
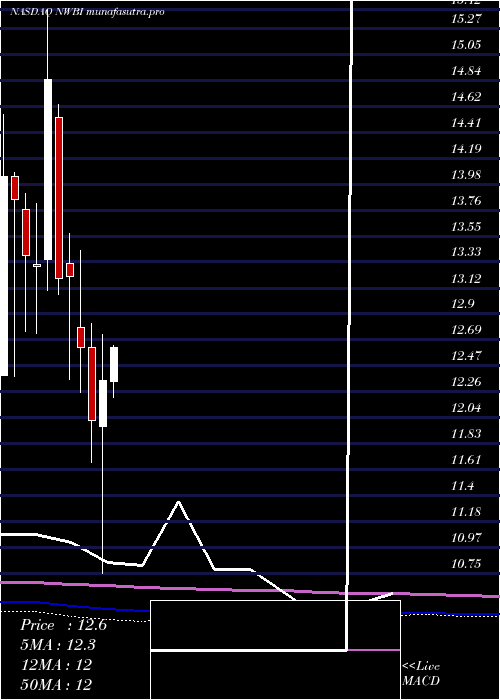
Monthly price and charts NorthwestBancshares Strong monthly Stock price targets for NorthwestBancshares NWBI are 12.02 and 12.7 | Monthly Target 1 | 11.51 | | Monthly Target 2 | 11.84 | | Monthly Target 3 | 12.19 | | Monthly Target 4 | 12.52 | | Monthly Target 5 | 12.87 |
Monthly price and volumes Northwest Bancshares
| Date |
Closing |
Open |
Range |
Volume |
Fri 05 December 2025 |
12.17 (1.76%) |
11.86 |
11.86 - 12.54 |
0.2582 times |
Fri 28 November 2025 |
11.96 (2.13%) |
11.83 |
11.25 - 12.28 |
0.9682 times |
Fri 31 October 2025 |
11.71 (-5.49%) |
12.28 |
11.61 - 12.80 |
1.2953 times |
Tue 30 September 2025 |
12.39 (-2.06%) |
12.55 |
12.20 - 13.03 |
1.1106 times |
Fri 29 August 2025 |
12.65 (8.12%) |
11.63 |
11.39 - 12.77 |
1.1477 times |
Thu 31 July 2025 |
11.70 (-8.45%) |
12.71 |
11.67 - 13.62 |
1.4443 times |
Mon 30 June 2025 |
12.78 (4.07%) |
12.25 |
12.00 - 13.00 |
0.76 times |
Fri 30 May 2025 |
12.28 (-0.57%) |
12.34 |
12.03 - 12.92 |
0.8713 times |
Wed 30 April 2025 |
12.35 (2.75%) |
11.97 |
10.75 - 12.73 |
1.307 times |
Mon 31 March 2025 |
12.02 (-4.75%) |
12.62 |
11.67 - 12.82 |
0.8375 times |
Fri 28 February 2025 |
12.62 (-4.47%) |
12.79 |
12.25 - 13.43 |
0.7548 times |
DMA SMA EMA moving averages of Northwest Bancshares NWBI
DMA (daily moving average) of Northwest Bancshares NWBI
| DMA period | DMA value | | 5 day DMA | 12.26 | | 12 day DMA | 11.97 | | 20 day DMA | 11.85 | | 35 day DMA | 11.94 | | 50 day DMA | 12.07 | | 100 day DMA | 12.25 | | 150 day DMA | 12.38 | | 200 day DMA | 12.25 | EMA (exponential moving average) of Northwest Bancshares NWBI
| EMA period | EMA current | EMA prev | EMA prev2 | | 5 day EMA | 12.22 | 12.24 | 12.19 | | 12 day EMA | 12.06 | 12.04 | 11.99 | | 20 day EMA | 12 | 11.98 | 11.94 | | 35 day EMA | 12.04 | 12.03 | 12.01 | | 50 day EMA | 12.12 | 12.12 | 12.11 |
SMA (simple moving average) of Northwest Bancshares NWBI
| SMA period | SMA current | SMA prev | SMA prev2 | | 5 day SMA | 12.26 | 12.21 | 12.15 | | 12 day SMA | 11.97 | 11.91 | 11.83 | | 20 day SMA | 11.85 | 11.83 | 11.81 | | 35 day SMA | 11.94 | 11.93 | 11.94 | | 50 day SMA | 12.07 | 12.08 | 12.08 | | 100 day SMA | 12.25 | 12.26 | 12.27 | | 150 day SMA | 12.38 | 12.38 | 12.38 | | 200 day SMA | 12.25 | 12.26 | 12.26 |
|
|
