IntelliaTherapeutics NTLA full analysis,charts,indicators,moving averages,SMA,DMA,EMA,ADX,MACD,RSIIntellia Therapeutics NTLA WideScreen charts, DMA,SMA,EMA technical analysis, forecast prediction, by indicators ADX,MACD,RSI,CCI NASDAQ stock exchange
operates under Health Care sector & deals in Biotechnology In Vitro In Vivo Diagnostic Substances
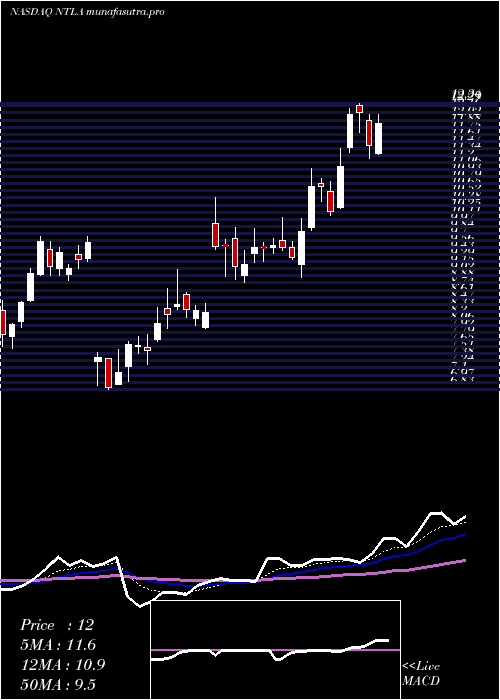
Daily price and charts and targets IntelliaTherapeutics Strong Daily Stock price targets for IntelliaTherapeutics NTLA are 9.49 and 9.79 | Daily Target 1 | 9.24 | | Daily Target 2 | 9.43 | | Daily Target 3 | 9.5433333333333 | | Daily Target 4 | 9.73 | | Daily Target 5 | 9.84 |
Daily price and volume Intellia Therapeutics
| Date |
Closing |
Open |
Range |
Volume |
Fri 05 December 2025 |
9.61 (-1.44%) |
9.59 |
9.36 - 9.66 |
1.0049 times |
Thu 04 December 2025 |
9.75 (7.62%) |
8.98 |
8.85 - 9.92 |
1.1865 times |
Wed 03 December 2025 |
9.06 (11.71%) |
8.23 |
8.13 - 9.12 |
1.1831 times |
Tue 02 December 2025 |
8.11 (-3.68%) |
8.53 |
8.09 - 8.56 |
0.8756 times |
Mon 01 December 2025 |
8.42 (-6.34%) |
8.81 |
8.40 - 8.89 |
1.13 times |
Fri 28 November 2025 |
8.99 (5.39%) |
8.62 |
8.53 - 9.10 |
0.9245 times |
Wed 26 November 2025 |
8.53 (-0.12%) |
8.64 |
8.40 - 8.68 |
0.6091 times |
Tue 25 November 2025 |
8.54 (2.28%) |
8.34 |
8.18 - 8.61 |
0.7967 times |
Mon 24 November 2025 |
8.35 (1.71%) |
8.46 |
8.14 - 8.51 |
0.7329 times |
Fri 21 November 2025 |
8.21 (2.11%) |
8.15 |
7.95 - 8.43 |
1.5566 times |
Thu 20 November 2025 |
8.04 (-2.43%) |
8.50 |
7.95 - 8.88 |
1.5451 times |
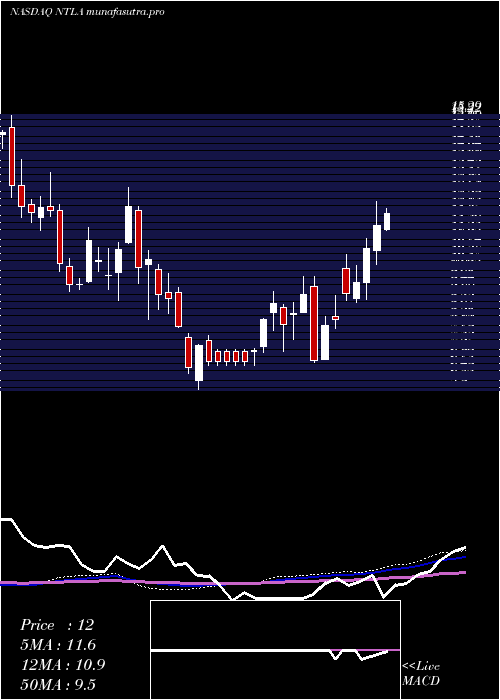
Weekly price and charts IntelliaTherapeutics Strong weekly Stock price targets for IntelliaTherapeutics NTLA are 8.85 and 10.68 | Weekly Target 1 | 7.38 | | Weekly Target 2 | 8.49 | | Weekly Target 3 | 9.2066666666667 | | Weekly Target 4 | 10.32 | | Weekly Target 5 | 11.04 |
Weekly price and volumes for Intellia Therapeutics
| Date |
Closing |
Open |
Range |
Volume |
Fri 05 December 2025 |
9.61 (6.9%) |
8.81 |
8.09 - 9.92 |
0.6064 times |
Fri 28 November 2025 |
8.99 (9.5%) |
8.46 |
8.14 - 9.10 |
0.3452 times |
Fri 21 November 2025 |
8.21 (-5.63%) |
8.56 |
7.95 - 8.88 |
0.7486 times |
Fri 14 November 2025 |
8.70 (-8.42%) |
10.71 |
8.38 - 10.77 |
1.1267 times |
Fri 07 November 2025 |
9.50 (-24.72%) |
12.60 |
8.53 - 13.69 |
1.0862 times |
Fri 31 October 2025 |
12.62 (0%) |
12.55 |
12.13 - 13.38 |
0.3999 times |
Fri 31 October 2025 |
12.62 (-50.7%) |
13.73 |
11.63 - 16.76 |
3.2306 times |
Fri 24 October 2025 |
25.60 (2.4%) |
25.34 |
24.14 - 28.25 |
0.5539 times |
Fri 17 October 2025 |
25.00 (1.96%) |
24.88 |
21.89 - 26.82 |
0.6886 times |
Fri 10 October 2025 |
24.52 (21.27%) |
21.00 |
19.89 - 26.99 |
1.2138 times |
Fri 03 October 2025 |
20.22 (23.97%) |
16.51 |
16.35 - 21.75 |
0.7661 times |
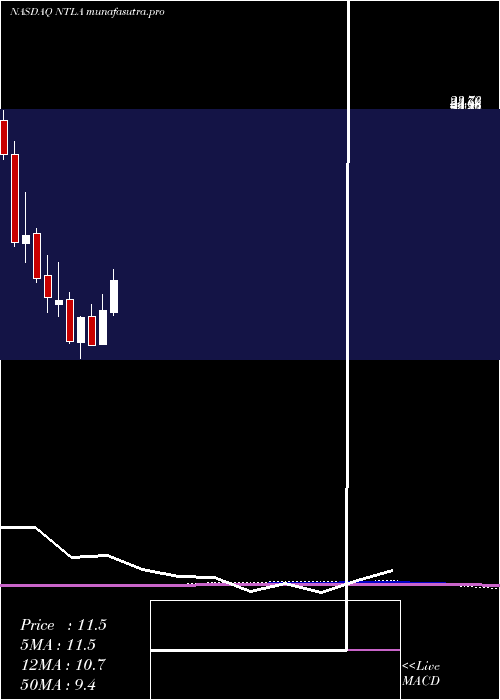
Monthly price and charts IntelliaTherapeutics Strong monthly Stock price targets for IntelliaTherapeutics NTLA are 8.85 and 10.68 | Monthly Target 1 | 7.38 | | Monthly Target 2 | 8.49 | | Monthly Target 3 | 9.2066666666667 | | Monthly Target 4 | 10.32 | | Monthly Target 5 | 11.04 |
Monthly price and volumes Intellia Therapeutics
| Date |
Closing |
Open |
Range |
Volume |
Fri 05 December 2025 |
9.61 (6.9%) |
8.81 |
8.09 - 9.92 |
0.2085 times |
Fri 28 November 2025 |
8.99 (-28.76%) |
12.60 |
7.95 - 13.69 |
1.1369 times |
Fri 31 October 2025 |
12.62 (-26.93%) |
17.38 |
11.63 - 28.25 |
2.2629 times |
Tue 30 September 2025 |
17.27 (52.16%) |
11.17 |
10.89 - 18.58 |
1.3021 times |
Fri 29 August 2025 |
11.35 (-2.49%) |
11.30 |
9.82 - 12.10 |
0.877 times |
Thu 31 July 2025 |
11.64 (24.09%) |
9.23 |
8.98 - 14.61 |
1.0321 times |
Mon 30 June 2025 |
9.38 (36.54%) |
6.93 |
6.92 - 10.52 |
0.9183 times |
Fri 30 May 2025 |
6.87 (-22.55%) |
8.90 |
6.83 - 9.78 |
0.9811 times |
Wed 30 April 2025 |
8.87 (24.75%) |
7.08 |
5.90 - 8.94 |
0.6654 times |
Mon 31 March 2025 |
7.11 (-29.53%) |
10.18 |
6.98 - 10.68 |
0.6158 times |
Fri 28 February 2025 |
10.09 (-2.23%) |
9.79 |
8.96 - 12.84 |
0.6346 times |
DMA SMA EMA moving averages of Intellia Therapeutics NTLA
DMA (daily moving average) of Intellia Therapeutics NTLA
| DMA period | DMA value | | 5 day DMA | 8.99 | | 12 day DMA | 8.65 | | 20 day DMA | 8.85 | | 35 day DMA | 12.87 | | 50 day DMA | 15.49 | | 100 day DMA | 13.88 | | 150 day DMA | 12.31 | | 200 day DMA | 11.33 | EMA (exponential moving average) of Intellia Therapeutics NTLA
| EMA period | EMA current | EMA prev | EMA prev2 | | 5 day EMA | 9.2 | 9 | 8.63 | | 12 day EMA | 9.14 | 9.06 | 8.93 | | 20 day EMA | 9.94 | 9.98 | 10 | | 35 day EMA | 12.23 | 12.38 | 12.54 | | 50 day EMA | 14.96 | 15.18 | 15.4 |
SMA (simple moving average) of Intellia Therapeutics NTLA
| SMA period | SMA current | SMA prev | SMA prev2 | | 5 day SMA | 8.99 | 8.87 | 8.62 | | 12 day SMA | 8.65 | 8.56 | 8.45 | | 20 day SMA | 8.85 | 8.99 | 9.18 | | 35 day SMA | 12.87 | 13.31 | 13.77 | | 50 day SMA | 15.49 | 15.63 | 15.79 | | 100 day SMA | 13.88 | 13.9 | 13.92 | | 150 day SMA | 12.31 | 12.3 | 12.3 | | 200 day SMA | 11.33 | 11.34 | 11.35 |
|
|
