NnInc NNBR full analysis,charts,indicators,moving averages,SMA,DMA,EMA,ADX,MACD,RSINn Inc NNBR WideScreen charts, DMA,SMA,EMA technical analysis, forecast prediction, by indicators ADX,MACD,RSI,CCI NASDAQ stock exchange
operates under Capital Goods sector & deals in Metal Fabrications
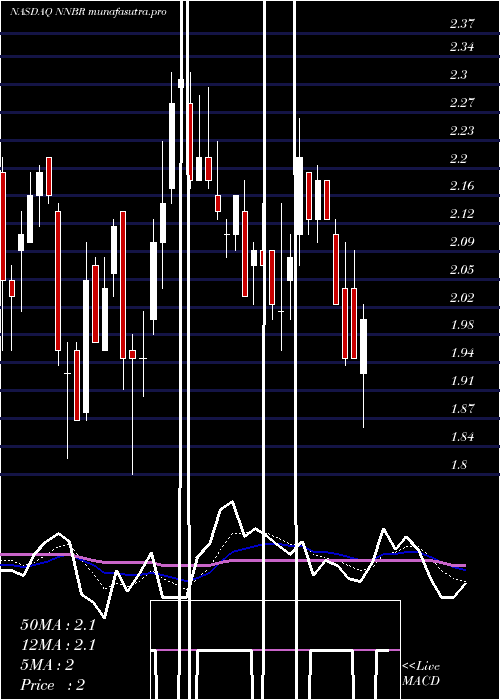
Daily price and charts and targets NnInc Strong Daily Stock price targets for NnInc NNBR are 1.17 and 1.25 | Daily Target 1 | 1.15 | | Daily Target 2 | 1.19 | | Daily Target 3 | 1.2333333333333 | | Daily Target 4 | 1.27 | | Daily Target 5 | 1.31 |
Daily price and volume Nn Inc
| Date |
Closing |
Open |
Range |
Volume |
Fri 05 December 2025 |
1.22 (-3.94%) |
1.26 |
1.20 - 1.28 |
0.8689 times |
Thu 04 December 2025 |
1.27 (0%) |
1.28 |
1.25 - 1.35 |
1.2337 times |
Wed 03 December 2025 |
1.27 (2.42%) |
1.29 |
1.24 - 1.29 |
0.7856 times |
Tue 02 December 2025 |
1.24 (1.64%) |
1.26 |
1.24 - 1.37 |
1.2218 times |
Mon 01 December 2025 |
1.22 (-3.94%) |
1.27 |
1.22 - 1.32 |
1.0951 times |
Fri 28 November 2025 |
1.27 (1.6%) |
1.26 |
1.25 - 1.30 |
0.3471 times |
Wed 26 November 2025 |
1.25 (-8.09%) |
1.37 |
1.22 - 1.37 |
1.6248 times |
Tue 25 November 2025 |
1.36 (5.43%) |
1.31 |
1.30 - 1.44 |
0.9868 times |
Mon 24 November 2025 |
1.29 (3.2%) |
1.26 |
1.26 - 1.46 |
1.4573 times |
Fri 21 November 2025 |
1.25 (-2.34%) |
1.29 |
1.24 - 1.31 |
0.3789 times |
Thu 20 November 2025 |
1.28 (0.79%) |
1.27 |
1.20 - 1.29 |
0.4194 times |
Weekly price and charts NnInc Strong weekly Stock price targets for NnInc NNBR are 1.13 and 1.3 | Weekly Target 1 | 1.09 | | Weekly Target 2 | 1.16 | | Weekly Target 3 | 1.2633333333333 | | Weekly Target 4 | 1.33 | | Weekly Target 5 | 1.43 |
Weekly price and volumes for Nn Inc
| Date |
Closing |
Open |
Range |
Volume |
Fri 05 December 2025 |
1.22 (-3.94%) |
1.27 |
1.20 - 1.37 |
2.2515 times |
Fri 28 November 2025 |
1.27 (1.6%) |
1.26 |
1.22 - 1.46 |
1.9102 times |
Fri 21 November 2025 |
1.25 (-13.79%) |
1.52 |
1.20 - 1.55 |
1.3014 times |
Fri 14 November 2025 |
1.45 (-12.65%) |
1.68 |
1.42 - 1.76 |
1.2638 times |
Fri 07 November 2025 |
1.66 (-2.92%) |
1.78 |
1.62 - 1.89 |
0.4673 times |
Fri 31 October 2025 |
1.71 (0%) |
1.63 |
1.59 - 1.74 |
0.1866 times |
Fri 31 October 2025 |
1.71 (-6.04%) |
1.85 |
1.57 - 1.98 |
1.124 times |
Fri 24 October 2025 |
1.82 (0.55%) |
1.82 |
1.78 - 1.92 |
0.2643 times |
Fri 17 October 2025 |
1.81 (-0.55%) |
1.98 |
1.73 - 1.99 |
0.5103 times |
Fri 10 October 2025 |
1.82 (-6.67%) |
1.99 |
1.81 - 2.10 |
0.7207 times |
Fri 03 October 2025 |
1.95 (-10.14%) |
2.16 |
1.93 - 2.16 |
0.5058 times |

Monthly price and charts NnInc Strong monthly Stock price targets for NnInc NNBR are 1.13 and 1.3 | Monthly Target 1 | 1.09 | | Monthly Target 2 | 1.16 | | Monthly Target 3 | 1.2633333333333 | | Monthly Target 4 | 1.33 | | Monthly Target 5 | 1.43 |
Monthly price and volumes Nn Inc
| Date |
Closing |
Open |
Range |
Volume |
Fri 05 December 2025 |
1.22 (-3.94%) |
1.27 |
1.20 - 1.37 |
0.5792 times |
Fri 28 November 2025 |
1.27 (-25.73%) |
1.78 |
1.20 - 1.89 |
1.2715 times |
Fri 31 October 2025 |
1.71 (-16.99%) |
2.03 |
1.57 - 2.14 |
0.813 times |
Tue 30 September 2025 |
2.06 (-19.84%) |
2.54 |
2.03 - 2.63 |
0.4037 times |
Fri 29 August 2025 |
2.57 (31.79%) |
1.93 |
1.86 - 2.63 |
0.5592 times |
Thu 31 July 2025 |
1.95 (-7.14%) |
2.10 |
1.94 - 2.37 |
0.5921 times |
Mon 30 June 2025 |
2.10 (2.44%) |
2.01 |
1.80 - 2.38 |
2.8164 times |
Fri 30 May 2025 |
2.05 (1.99%) |
2.02 |
1.62 - 2.36 |
1.1066 times |
Wed 30 April 2025 |
2.01 (-11.06%) |
2.25 |
1.58 - 2.46 |
0.9787 times |
Mon 31 March 2025 |
2.26 (-25.9%) |
3.05 |
2.25 - 3.12 |
0.8796 times |
Fri 28 February 2025 |
3.05 (0.33%) |
3.01 |
2.83 - 3.52 |
0.9024 times |
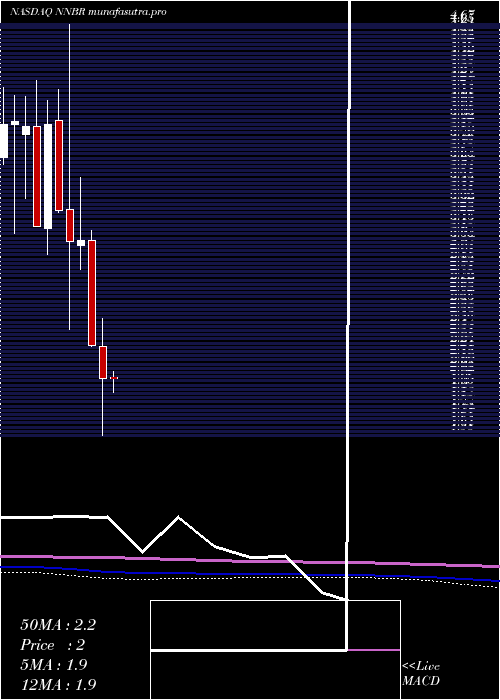
DMA SMA EMA moving averages of Nn Inc NNBR
DMA (daily moving average) of Nn Inc NNBR
| DMA period | DMA value | | 5 day DMA | 1.24 | | 12 day DMA | 1.27 | | 20 day DMA | 1.36 | | 35 day DMA | 1.55 | | 50 day DMA | 1.67 | | 100 day DMA | 1.97 | | 150 day DMA | 2 | | 200 day DMA | 2.07 | EMA (exponential moving average) of Nn Inc NNBR
| EMA period | EMA current | EMA prev | EMA prev2 | | 5 day EMA | 1.25 | 1.26 | 1.26 | | 12 day EMA | 1.3 | 1.31 | 1.32 | | 20 day EMA | 1.38 | 1.4 | 1.41 | | 35 day EMA | 1.5 | 1.52 | 1.53 | | 50 day EMA | 1.67 | 1.69 | 1.71 |
SMA (simple moving average) of Nn Inc NNBR
| SMA period | SMA current | SMA prev | SMA prev2 | | 5 day SMA | 1.24 | 1.25 | 1.25 | | 12 day SMA | 1.27 | 1.28 | 1.29 | | 20 day SMA | 1.36 | 1.38 | 1.41 | | 35 day SMA | 1.55 | 1.56 | 1.58 | | 50 day SMA | 1.67 | 1.69 | 1.71 | | 100 day SMA | 1.97 | 1.98 | 1.99 | | 150 day SMA | 2 | 2.01 | 2.01 | | 200 day SMA | 2.07 | 2.07 | 2.08 |
|
|
