NewtekBusiness NEWT full analysis,charts,indicators,moving averages,SMA,DMA,EMA,ADX,MACD,RSINewtek Business NEWT WideScreen charts, DMA,SMA,EMA technical analysis, forecast prediction, by indicators ADX,MACD,RSI,CCI NASDAQ stock exchange
operates under N A sector & deals in N A
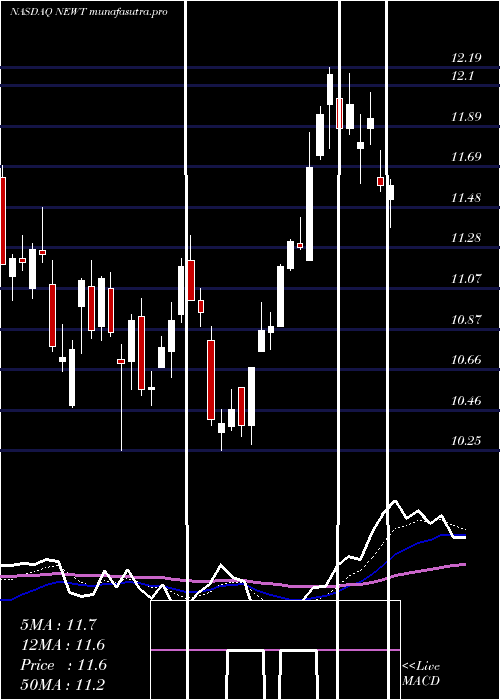
Daily price and charts and targets NewtekBusiness Strong Daily Stock price targets for NewtekBusiness NEWT are 11.03 and 11.24 | Daily Target 1 | 10.97 | | Daily Target 2 | 11.09 | | Daily Target 3 | 11.183333333333 | | Daily Target 4 | 11.3 | | Daily Target 5 | 11.39 |
Daily price and volume Newtek Business
| Date |
Closing |
Open |
Range |
Volume |
Fri 01 August 2025 |
11.20 (-2.1%) |
11.22 |
11.07 - 11.28 |
1.3645 times |
Thu 31 July 2025 |
11.44 (0.35%) |
11.27 |
11.07 - 11.46 |
1.4804 times |
Wed 30 July 2025 |
11.40 (0.09%) |
11.47 |
11.25 - 11.56 |
1.3805 times |
Tue 29 July 2025 |
11.39 (-3.64%) |
11.83 |
11.09 - 11.83 |
1.5611 times |
Mon 28 July 2025 |
11.82 (0.94%) |
11.71 |
11.63 - 12.08 |
0.9619 times |
Fri 25 July 2025 |
11.71 (0%) |
11.72 |
11.51 - 11.72 |
0.7768 times |
Thu 24 July 2025 |
11.71 (-3.38%) |
11.99 |
11.71 - 11.99 |
0.6143 times |
Wed 23 July 2025 |
12.12 (3.68%) |
11.78 |
11.72 - 12.15 |
0.7269 times |
Tue 22 July 2025 |
11.69 (1.83%) |
11.48 |
11.45 - 11.86 |
0.5676 times |
Mon 21 July 2025 |
11.48 (0.44%) |
11.49 |
11.45 - 11.61 |
0.566 times |
Fri 18 July 2025 |
11.43 (0%) |
11.50 |
11.31 - 11.53 |
0.505 times |
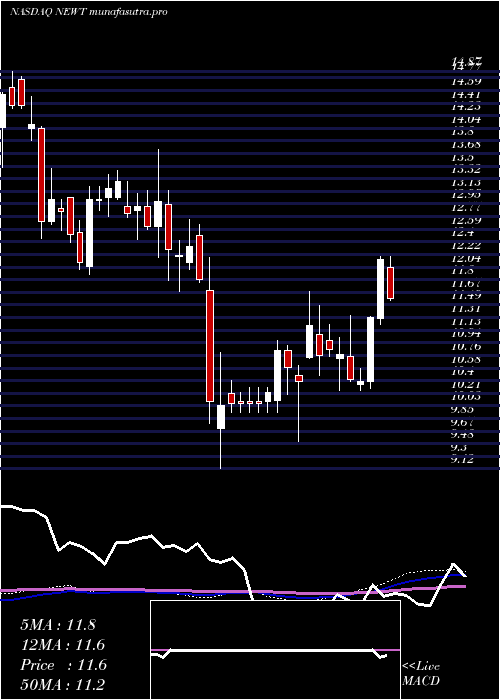
Weekly price and charts NewtekBusiness Strong weekly Stock price targets for NewtekBusiness NEWT are 10.63 and 11.64 | Weekly Target 1 | 10.44 | | Weekly Target 2 | 10.82 | | Weekly Target 3 | 11.45 | | Weekly Target 4 | 11.83 | | Weekly Target 5 | 12.46 |
Weekly price and volumes for Newtek Business
| Date |
Closing |
Open |
Range |
Volume |
Fri 01 August 2025 |
11.20 (-4.36%) |
11.71 |
11.07 - 12.08 |
2.0313 times |
Fri 25 July 2025 |
11.71 (2.45%) |
11.49 |
11.45 - 12.15 |
0.9787 times |
Fri 18 July 2025 |
11.43 (-1.38%) |
11.52 |
11.09 - 11.62 |
0.9152 times |
Fri 11 July 2025 |
11.59 (-4.61%) |
12.03 |
11.56 - 12.19 |
1.1727 times |
Thu 03 July 2025 |
12.15 (7.43%) |
11.30 |
11.21 - 12.19 |
0.6454 times |
Fri 27 June 2025 |
11.31 (8.96%) |
10.38 |
10.28 - 11.32 |
0.8493 times |
Fri 20 June 2025 |
10.38 (-0.29%) |
10.34 |
10.25 - 10.57 |
0.5126 times |
Fri 13 June 2025 |
10.41 (-3.34%) |
10.75 |
10.38 - 11.34 |
1.0974 times |
Fri 06 June 2025 |
10.77 (-0.74%) |
10.71 |
10.25 - 11.02 |
1.2066 times |
Fri 30 May 2025 |
10.85 (0.84%) |
10.98 |
10.74 - 11.21 |
0.5907 times |
Fri 23 May 2025 |
10.76 (-3.93%) |
11.07 |
10.47 - 11.48 |
0.8957 times |
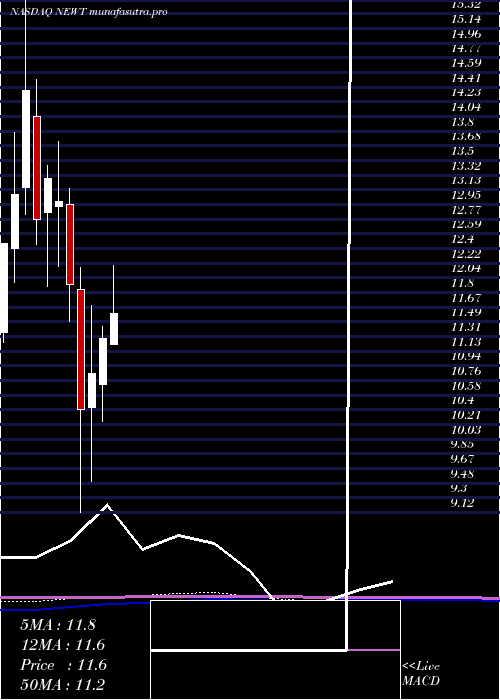
Monthly price and charts NewtekBusiness Strong monthly Stock price targets for NewtekBusiness NEWT are 11.03 and 11.24 | Monthly Target 1 | 10.97 | | Monthly Target 2 | 11.09 | | Monthly Target 3 | 11.183333333333 | | Monthly Target 4 | 11.3 | | Monthly Target 5 | 11.39 |
Monthly price and volumes Newtek Business
| Date |
Closing |
Open |
Range |
Volume |
Fri 01 August 2025 |
11.20 (-2.1%) |
11.22 |
11.07 - 11.28 |
0.1085 times |
Thu 31 July 2025 |
11.44 (1.42%) |
11.21 |
11.07 - 12.19 |
1.3828 times |
Mon 30 June 2025 |
11.28 (3.96%) |
10.71 |
10.25 - 11.43 |
0.9951 times |
Fri 30 May 2025 |
10.85 (4.33%) |
10.42 |
9.51 - 11.69 |
1.5587 times |
Wed 30 April 2025 |
10.40 (-13.04%) |
11.90 |
9.12 - 12.17 |
1.6802 times |
Mon 31 March 2025 |
11.96 (-7.93%) |
12.95 |
11.49 - 13.15 |
1.0381 times |
Fri 28 February 2025 |
12.99 (-2.18%) |
12.92 |
12.18 - 13.74 |
1.0148 times |
Fri 31 January 2025 |
13.28 (3.99%) |
12.85 |
11.93 - 13.44 |
0.6642 times |
Tue 31 December 2024 |
12.77 (-11.13%) |
14.04 |
12.45 - 14.50 |
0.7511 times |
Tue 26 November 2024 |
14.37 (9.86%) |
13.16 |
12.83 - 15.49 |
0.8065 times |
Thu 31 October 2024 |
13.08 (4.98%) |
12.40 |
11.98 - 13.85 |
0.8209 times |
DMA SMA EMA moving averages of Newtek Business NEWT
DMA (daily moving average) of Newtek Business NEWT
| DMA period | DMA value | | 5 day DMA | 11.45 | | 12 day DMA | 11.57 | | 20 day DMA | 11.61 | | 35 day DMA | 11.36 | | 50 day DMA | 11.21 | | 100 day DMA | 11.09 | | 150 day DMA | 11.65 | | 200 day DMA | 12.15 | EMA (exponential moving average) of Newtek Business NEWT
| EMA period | EMA current | EMA prev | EMA prev2 | | 5 day EMA | 11.41 | 11.51 | 11.55 | | 12 day EMA | 11.51 | 11.57 | 11.59 | | 20 day EMA | 11.5 | 11.53 | 11.54 | | 35 day EMA | 11.39 | 11.4 | 11.4 | | 50 day EMA | 11.25 | 11.25 | 11.24 |
SMA (simple moving average) of Newtek Business NEWT
| SMA period | SMA current | SMA prev | SMA prev2 | | 5 day SMA | 11.45 | 11.55 | 11.61 | | 12 day SMA | 11.57 | 11.58 | 11.56 | | 20 day SMA | 11.61 | 11.65 | 11.68 | | 35 day SMA | 11.36 | 11.36 | 11.35 | | 50 day SMA | 11.21 | 11.22 | 11.21 | | 100 day SMA | 11.09 | 11.1 | 11.11 | | 150 day SMA | 11.65 | 11.66 | 11.68 | | 200 day SMA | 12.15 | 12.16 | 12.16 |
|
|
