NortheastCommunity NECB full analysis,charts,indicators,moving averages,SMA,DMA,EMA,ADX,MACD,RSINortheast Community NECB WideScreen charts, DMA,SMA,EMA technical analysis, forecast prediction, by indicators ADX,MACD,RSI,CCI NASDAQ stock exchange
operates under Finance sector & deals in Savings Institutions
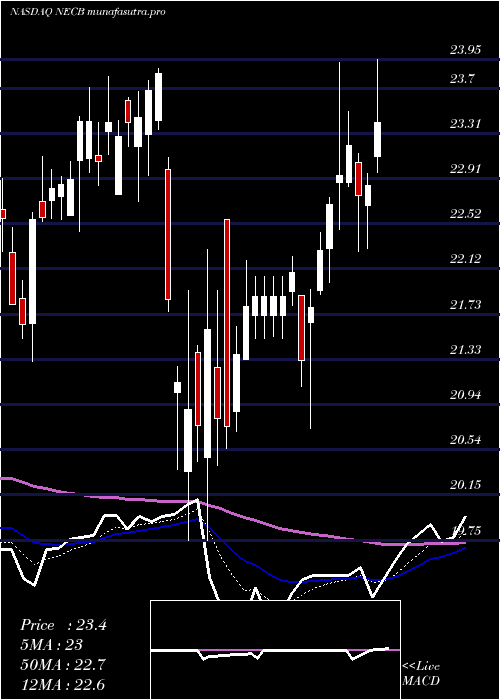
Daily price and charts and targets NortheastCommunity Strong Daily Stock price targets for NortheastCommunity NECB are 23.7 and 24.13 | Daily Target 1 | 23.37 | | Daily Target 2 | 23.6 | | Daily Target 3 | 23.803333333333 | | Daily Target 4 | 24.03 | | Daily Target 5 | 24.23 |
Daily price and volume Northeast Community
| Date |
Closing |
Open |
Range |
Volume |
Mon 14 July 2025 |
23.82 (0.63%) |
23.77 |
23.58 - 24.01 |
0.6871 times |
Fri 11 July 2025 |
23.67 (-1.46%) |
23.83 |
23.58 - 23.86 |
0.8375 times |
Thu 10 July 2025 |
24.02 (-0.83%) |
24.25 |
23.99 - 24.45 |
0.6694 times |
Wed 09 July 2025 |
24.22 (-0.33%) |
24.22 |
23.83 - 24.31 |
0.811 times |
Tue 08 July 2025 |
24.30 (2.02%) |
23.99 |
23.98 - 24.62 |
1.0882 times |
Mon 07 July 2025 |
23.82 (-3.48%) |
24.34 |
23.81 - 24.63 |
0.8611 times |
Thu 03 July 2025 |
24.68 (1.52%) |
24.50 |
24.08 - 24.81 |
0.5072 times |
Wed 02 July 2025 |
24.31 (1.72%) |
23.99 |
23.89 - 24.49 |
0.9407 times |
Tue 01 July 2025 |
23.90 (2.8%) |
23.05 |
23.05 - 24.45 |
2.7485 times |
Mon 30 June 2025 |
23.25 (-0.39%) |
23.43 |
23.10 - 23.80 |
0.8493 times |
Fri 27 June 2025 |
23.34 (-0.09%) |
23.32 |
23.05 - 23.56 |
2.1852 times |
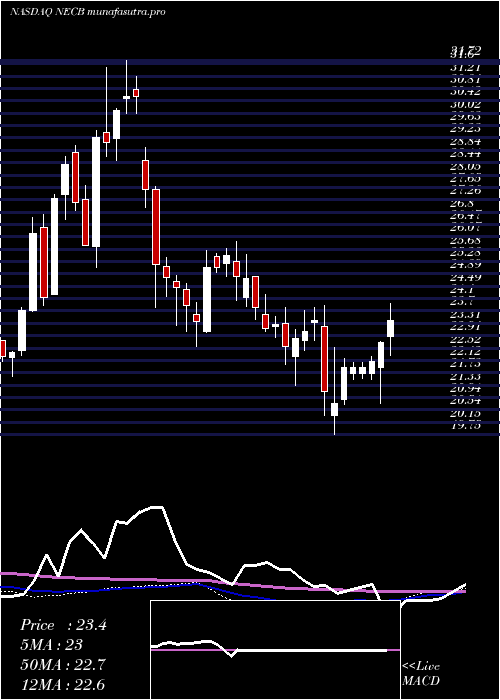
Weekly price and charts NortheastCommunity Strong weekly Stock price targets for NortheastCommunity NECB are 23.7 and 24.13 | Weekly Target 1 | 23.37 | | Weekly Target 2 | 23.6 | | Weekly Target 3 | 23.803333333333 | | Weekly Target 4 | 24.03 | | Weekly Target 5 | 24.23 |
Weekly price and volumes for Northeast Community
| Date |
Closing |
Open |
Range |
Volume |
Mon 14 July 2025 |
23.82 (0.63%) |
23.77 |
23.58 - 24.01 |
0.1786 times |
Fri 11 July 2025 |
23.67 (-4.09%) |
24.34 |
23.58 - 24.63 |
1.109 times |
Thu 03 July 2025 |
24.68 (5.74%) |
23.43 |
23.05 - 24.81 |
1.3113 times |
Fri 27 June 2025 |
23.34 (3.27%) |
22.40 |
22.05 - 23.73 |
1.5857 times |
Fri 20 June 2025 |
22.60 (1.94%) |
21.94 |
21.82 - 23.10 |
0.8124 times |
Fri 13 June 2025 |
22.17 (-0.98%) |
22.46 |
22.17 - 23.15 |
0.9296 times |
Fri 06 June 2025 |
22.39 (-1.02%) |
22.55 |
21.81 - 22.73 |
1.053 times |
Fri 30 May 2025 |
22.62 (-1.18%) |
23.21 |
22.55 - 23.62 |
0.7871 times |
Fri 23 May 2025 |
22.89 (-2.6%) |
23.15 |
22.41 - 23.86 |
1.0952 times |
Fri 16 May 2025 |
23.50 (1.21%) |
24.11 |
23.15 - 24.70 |
1.1381 times |
Fri 09 May 2025 |
23.22 (-0.77%) |
23.37 |
22.85 - 23.90 |
1.0852 times |
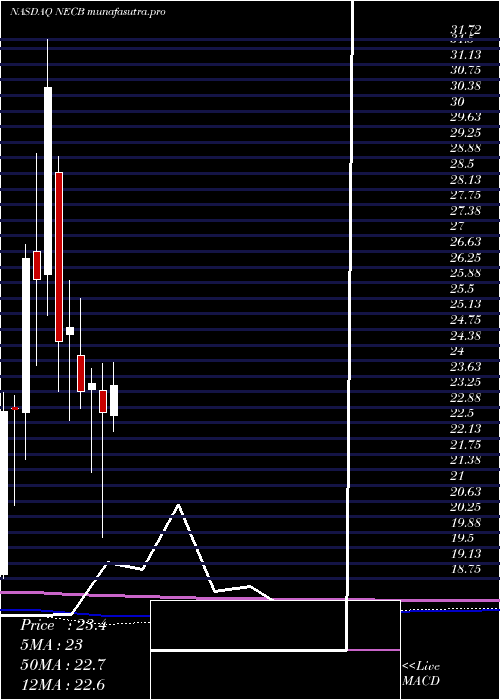
Monthly price and charts NortheastCommunity Strong monthly Stock price targets for NortheastCommunity NECB are 23.44 and 25.2 | Monthly Target 1 | 22.13 | | Monthly Target 2 | 22.98 | | Monthly Target 3 | 23.893333333333 | | Monthly Target 4 | 24.74 | | Monthly Target 5 | 25.65 |
Monthly price and volumes Northeast Community
| Date |
Closing |
Open |
Range |
Volume |
Mon 14 July 2025 |
23.82 (2.45%) |
23.05 |
23.05 - 24.81 |
0.2894 times |
Mon 30 June 2025 |
23.25 (2.79%) |
22.55 |
21.81 - 23.80 |
0.56 times |
Fri 30 May 2025 |
22.62 (-0.62%) |
22.67 |
22.30 - 24.70 |
0.5603 times |
Wed 30 April 2025 |
22.76 (-2.9%) |
23.29 |
19.75 - 23.92 |
0.8612 times |
Mon 31 March 2025 |
23.44 (0.77%) |
23.30 |
21.31 - 23.80 |
1.0489 times |
Fri 28 February 2025 |
23.26 (-6.21%) |
24.13 |
22.85 - 25.49 |
0.7607 times |
Fri 31 January 2025 |
24.80 (1.39%) |
24.63 |
22.57 - 25.93 |
1.5896 times |
Tue 31 December 2024 |
24.46 (-19.96%) |
28.52 |
23.25 - 28.91 |
1.208 times |
Tue 26 November 2024 |
30.56 (17.72%) |
26.07 |
25.09 - 31.72 |
1.3345 times |
Thu 31 October 2024 |
25.96 (-1.85%) |
26.62 |
23.89 - 28.99 |
1.7873 times |
Mon 30 September 2024 |
26.45 (15.81%) |
22.75 |
21.62 - 26.79 |
1.3919 times |
DMA SMA EMA moving averages of Northeast Community NECB
DMA (daily moving average) of Northeast Community NECB
| DMA period | DMA value | | 5 day DMA | 24.01 | | 12 day DMA | 23.89 | | 20 day DMA | 23.4 | | 35 day DMA | 23.08 | | 50 day DMA | 23.19 | | 100 day DMA | 22.87 | | 150 day DMA | 23.71 | | 200 day DMA | 24.53 | EMA (exponential moving average) of Northeast Community NECB
| EMA period | EMA current | EMA prev | EMA prev2 | | 5 day EMA | 23.91 | 23.95 | 24.09 | | 12 day EMA | 23.78 | 23.77 | 23.79 | | 20 day EMA | 23.58 | 23.55 | 23.54 | | 35 day EMA | 23.4 | 23.37 | 23.35 | | 50 day EMA | 23.21 | 23.19 | 23.17 |
SMA (simple moving average) of Northeast Community NECB
| SMA period | SMA current | SMA prev | SMA prev2 | | 5 day SMA | 24.01 | 24.01 | 24.21 | | 12 day SMA | 23.89 | 23.82 | 23.8 | | 20 day SMA | 23.4 | 23.36 | 23.32 | | 35 day SMA | 23.08 | 23.08 | 23.07 | | 50 day SMA | 23.19 | 23.18 | 23.16 | | 100 day SMA | 22.87 | 22.87 | 22.87 | | 150 day SMA | 23.71 | 23.76 | 23.8 | | 200 day SMA | 24.53 | 24.52 | 24.51 |
|
|
