The9 NCTY full analysis,charts,indicators,moving averages,SMA,DMA,EMA,ADX,MACD,RSIThe9 NCTY WideScreen charts, DMA,SMA,EMA technical analysis, forecast prediction, by indicators ADX,MACD,RSI,CCI NASDAQ stock exchange
operates under Miscellaneous sector & deals in Business Services
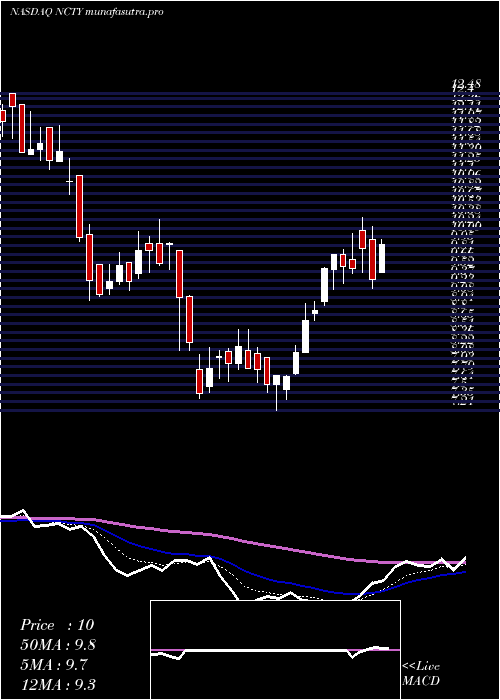
Daily price and charts and targets The9 Strong Daily Stock price targets for The9 NCTY are 8.24 and 8.76 | Daily Target 1 | 8.11 | | Daily Target 2 | 8.36 | | Daily Target 3 | 8.6266666666667 | | Daily Target 4 | 8.88 | | Daily Target 5 | 9.15 |
Daily price and volume The9
| Date |
Closing |
Open |
Range |
Volume |
Thu 31 July 2025 |
8.62 (-4.75%) |
8.79 |
8.37 - 8.89 |
0.6262 times |
Wed 30 July 2025 |
9.05 (1.69%) |
8.88 |
8.81 - 9.31 |
0.7128 times |
Tue 29 July 2025 |
8.90 (-6.81%) |
9.35 |
8.85 - 9.35 |
0.7079 times |
Mon 28 July 2025 |
9.55 (4.6%) |
9.30 |
9.20 - 9.63 |
0.4975 times |
Fri 25 July 2025 |
9.13 (-6.45%) |
9.61 |
9.13 - 9.61 |
0.448 times |
Thu 24 July 2025 |
9.76 (1.67%) |
9.68 |
9.37 - 9.82 |
0.792 times |
Wed 23 July 2025 |
9.60 (1.16%) |
9.49 |
9.35 - 9.64 |
0.2401 times |
Tue 22 July 2025 |
9.49 (1.06%) |
9.56 |
9.13 - 9.56 |
0.3787 times |
Mon 21 July 2025 |
9.39 (-6.85%) |
10.15 |
9.38 - 10.35 |
2.3142 times |
Fri 18 July 2025 |
10.08 (5.99%) |
9.93 |
9.56 - 10.19 |
3.2825 times |
Thu 17 July 2025 |
9.51 (-4.61%) |
9.93 |
9.51 - 10.20 |
2.1934 times |
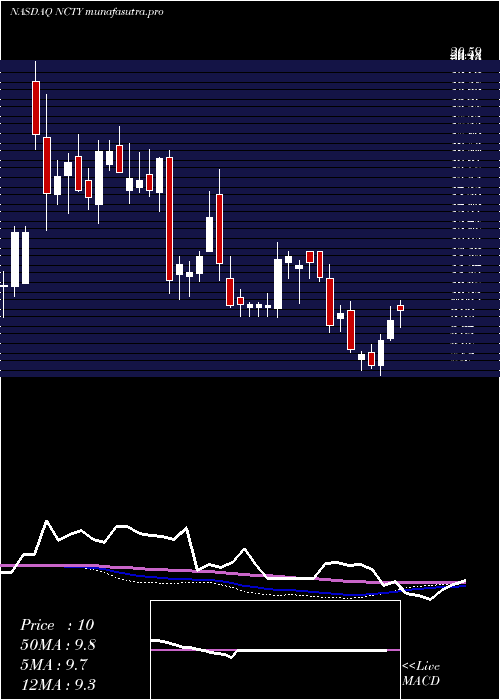
Weekly price and charts The9 Strong weekly Stock price targets for The9 NCTY are 7.87 and 9.13 | Weekly Target 1 | 7.61 | | Weekly Target 2 | 8.12 | | Weekly Target 3 | 8.8733333333333 | | Weekly Target 4 | 9.38 | | Weekly Target 5 | 10.13 |
Weekly price and volumes for The9
| Date |
Closing |
Open |
Range |
Volume |
Thu 31 July 2025 |
8.62 (-5.59%) |
9.30 |
8.37 - 9.63 |
0.3068 times |
Fri 25 July 2025 |
9.13 (-9.42%) |
10.15 |
9.13 - 10.35 |
0.5032 times |
Fri 18 July 2025 |
10.08 (5.33%) |
10.20 |
9.24 - 10.41 |
1.2968 times |
Fri 11 July 2025 |
9.57 (9.87%) |
8.81 |
8.70 - 10.15 |
0.8076 times |
Thu 03 July 2025 |
8.71 (14.01%) |
7.64 |
7.21 - 8.98 |
0.7598 times |
Fri 27 June 2025 |
7.64 (-5.8%) |
8.18 |
7.51 - 8.55 |
0.9869 times |
Fri 20 June 2025 |
8.11 (-2.76%) |
7.88 |
7.41 - 8.25 |
0.6989 times |
Fri 13 June 2025 |
8.34 (-15.42%) |
9.98 |
8.20 - 10.38 |
1.8366 times |
Fri 06 June 2025 |
9.86 (5.34%) |
9.63 |
9.10 - 10.18 |
1.4104 times |
Fri 30 May 2025 |
9.36 (-17.68%) |
11.34 |
9.03 - 11.95 |
1.3931 times |
Fri 23 May 2025 |
11.37 (-5.33%) |
12.48 |
11.21 - 12.48 |
0.4754 times |
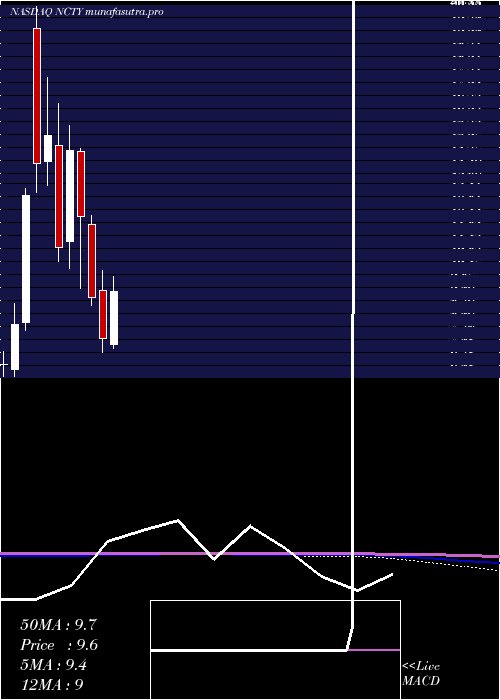
Monthly price and charts The9 Strong monthly Stock price targets for The9 NCTY are 8 and 11.03 | Monthly Target 1 | 5.77 | | Monthly Target 2 | 7.2 | | Monthly Target 3 | 8.8033333333333 | | Monthly Target 4 | 10.23 | | Monthly Target 5 | 11.83 |
Monthly price and volumes The9
| Date |
Closing |
Open |
Range |
Volume |
Thu 31 July 2025 |
8.62 (10.8%) |
7.55 |
7.38 - 10.41 |
0.5575 times |
Mon 30 June 2025 |
7.78 (-16.88%) |
9.63 |
7.21 - 10.38 |
0.8372 times |
Fri 30 May 2025 |
9.36 (-25%) |
12.17 |
9.03 - 12.51 |
0.9162 times |
Wed 30 April 2025 |
12.48 (-16.86%) |
15.00 |
9.70 - 15.09 |
1.0303 times |
Mon 31 March 2025 |
15.01 (33.07%) |
11.50 |
10.45 - 15.98 |
0.6359 times |
Fri 28 February 2025 |
11.28 (-27.74%) |
15.22 |
10.72 - 16.85 |
0.7049 times |
Fri 31 January 2025 |
15.61 (7.36%) |
14.60 |
13.68 - 17.83 |
1.2743 times |
Tue 31 December 2024 |
14.54 (9.41%) |
19.73 |
13.41 - 20.59 |
1.2509 times |
Tue 26 November 2024 |
13.29 (60.31%) |
8.37 |
8.08 - 13.54 |
1.9034 times |
Thu 31 October 2024 |
8.29 (22.81%) |
6.58 |
6.28 - 9.10 |
0.8894 times |
Mon 30 September 2024 |
6.75 (-4.93%) |
7.50 |
6.28 - 7.53 |
0.171 times |
DMA SMA EMA moving averages of The9 NCTY
DMA (daily moving average) of The9 NCTY
| DMA period | DMA value | | 5 day DMA | 9.05 | | 12 day DMA | 9.42 | | 20 day DMA | 9.42 | | 35 day DMA | 8.93 | | 50 day DMA | 9.4 | | 100 day DMA | 10.54 | | 150 day DMA | 12.01 | | 200 day DMA | 11.72 | EMA (exponential moving average) of The9 NCTY
| EMA period | EMA current | EMA prev | EMA prev2 | | 5 day EMA | 9.02 | 9.22 | 9.3 | | 12 day EMA | 9.22 | 9.33 | 9.38 | | 20 day EMA | 9.25 | 9.32 | 9.35 | | 35 day EMA | 9.5 | 9.55 | 9.58 | | 50 day EMA | 9.58 | 9.62 | 9.64 |
SMA (simple moving average) of The9 NCTY
| SMA period | SMA current | SMA prev | SMA prev2 | | 5 day SMA | 9.05 | 9.28 | 9.39 | | 12 day SMA | 9.42 | 9.48 | 9.56 | | 20 day SMA | 9.42 | 9.4 | 9.34 | | 35 day SMA | 8.93 | 8.96 | 8.98 | | 50 day SMA | 9.4 | 9.47 | 9.53 | | 100 day SMA | 10.54 | 10.57 | 10.6 | | 150 day SMA | 12.01 | 12.05 | 12.09 | | 200 day SMA | 11.72 | 11.71 | 11.69 |
|
|
