NathanS NATH full analysis,charts,indicators,moving averages,SMA,DMA,EMA,ADX,MACD,RSINathan S NATH WideScreen charts, DMA,SMA,EMA technical analysis, forecast prediction, by indicators ADX,MACD,RSI,CCI NASDAQ stock exchange
operates under Consumer Services sector & deals in Restaurants
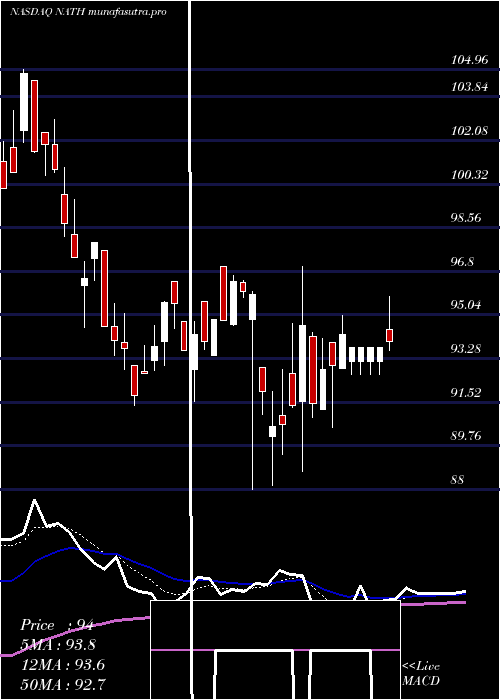
Daily price and charts and targets NathanS Strong Daily Stock price targets for NathanS NATH are 99.06 and 110.95 | Daily Target 1 | 97.01 | | Daily Target 2 | 101.11 | | Daily Target 3 | 108.90333333333 | | Daily Target 4 | 113 | | Daily Target 5 | 120.79 |
Daily price and volume Nathan S
| Date |
Closing |
Open |
Range |
Volume |
Tue 15 July 2025 |
105.20 (-9.11%) |
115.48 |
104.81 - 116.70 |
1.3595 times |
Mon 14 July 2025 |
115.75 (2.01%) |
113.40 |
112.80 - 116.98 |
1.971 times |
Fri 11 July 2025 |
113.47 (-1.63%) |
114.14 |
110.24 - 115.24 |
1.0618 times |
Thu 10 July 2025 |
115.35 (0.56%) |
113.80 |
112.00 - 117.49 |
1.2269 times |
Wed 09 July 2025 |
114.71 (1.27%) |
113.26 |
112.84 - 114.94 |
0.7747 times |
Tue 08 July 2025 |
113.27 (0%) |
112.90 |
110.93 - 113.43 |
1.1143 times |
Mon 07 July 2025 |
113.27 (0.44%) |
112.05 |
110.07 - 113.51 |
0.5333 times |
Thu 03 July 2025 |
112.77 (3.49%) |
110.06 |
109.81 - 112.77 |
0.3759 times |
Wed 02 July 2025 |
108.97 (-0.41%) |
109.28 |
107.05 - 110.30 |
1.1105 times |
Tue 01 July 2025 |
109.42 (-1.05%) |
109.77 |
108.67 - 111.63 |
0.4722 times |
Mon 30 June 2025 |
110.58 (0.1%) |
110.62 |
109.35 - 111.90 |
0.4932 times |
Weekly price and charts NathanS Strong weekly Stock price targets for NathanS NATH are 98.92 and 111.09 | Weekly Target 1 | 96.83 | | Weekly Target 2 | 101.01 | | Weekly Target 3 | 108.99666666667 | | Weekly Target 4 | 113.18 | | Weekly Target 5 | 121.17 |
Weekly price and volumes for Nathan S
| Date |
Closing |
Open |
Range |
Volume |
Tue 15 July 2025 |
105.20 (-7.29%) |
113.40 |
104.81 - 116.98 |
1.1827 times |
Fri 11 July 2025 |
113.47 (0.62%) |
112.05 |
110.07 - 117.49 |
1.6729 times |
Thu 03 July 2025 |
112.77 (2.08%) |
110.62 |
107.05 - 112.77 |
0.8707 times |
Fri 27 June 2025 |
110.47 (0.8%) |
109.74 |
105.70 - 113.60 |
1.4527 times |
Fri 20 June 2025 |
109.59 (-1.76%) |
110.07 |
108.68 - 112.90 |
0.767 times |
Fri 13 June 2025 |
111.55 (2.62%) |
108.33 |
107.00 - 118.50 |
1.2166 times |
Fri 06 June 2025 |
108.70 (1.61%) |
105.64 |
102.60 - 108.86 |
2.1347 times |
Fri 30 May 2025 |
106.98 (5.64%) |
101.48 |
100.90 - 107.00 |
0.3117 times |
Fri 23 May 2025 |
101.27 (-2.93%) |
104.20 |
99.84 - 106.25 |
0.1901 times |
Fri 16 May 2025 |
104.33 (5.32%) |
101.60 |
99.05 - 106.37 |
0.2009 times |
Fri 09 May 2025 |
99.06 (1.23%) |
97.58 |
97.30 - 104.96 |
0.1521 times |
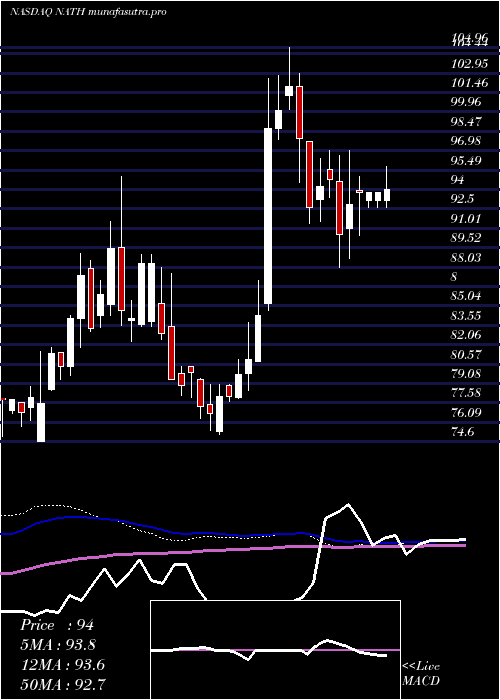
Monthly price and charts NathanS Strong monthly Stock price targets for NathanS NATH are 98.67 and 111.35 | Monthly Target 1 | 96.49 | | Monthly Target 2 | 100.84 | | Monthly Target 3 | 109.16666666667 | | Monthly Target 4 | 113.52 | | Monthly Target 5 | 121.85 |
Monthly price and volumes Nathan S
| Date |
Closing |
Open |
Range |
Volume |
Tue 15 July 2025 |
105.20 (-4.87%) |
109.77 |
104.81 - 117.49 |
2.2482 times |
Mon 30 June 2025 |
110.58 (3.37%) |
105.64 |
102.60 - 118.50 |
3.6379 times |
Fri 30 May 2025 |
106.98 (9.44%) |
98.46 |
95.84 - 107.00 |
0.5753 times |
Wed 30 April 2025 |
97.75 (1.42%) |
96.36 |
88.00 - 99.05 |
0.4393 times |
Mon 31 March 2025 |
96.38 (-5.43%) |
101.91 |
91.40 - 102.93 |
0.4488 times |
Fri 28 February 2025 |
101.91 (25.95%) |
80.81 |
80.81 - 104.96 |
0.7327 times |
Fri 31 January 2025 |
80.91 (2.93%) |
78.36 |
75.15 - 83.74 |
0.4325 times |
Tue 31 December 2024 |
78.61 (-11.02%) |
85.27 |
78.00 - 88.00 |
0.381 times |
Tue 26 November 2024 |
88.35 (4.89%) |
84.45 |
82.30 - 94.97 |
0.6525 times |
Thu 31 October 2024 |
84.23 (4.12%) |
80.61 |
79.40 - 89.10 |
0.4519 times |
Mon 30 September 2024 |
80.90 (3.94%) |
77.62 |
74.60 - 81.88 |
0.3786 times |

DMA SMA EMA moving averages of Nathan S NATH
DMA (daily moving average) of Nathan S NATH
| DMA period | DMA value | | 5 day DMA | 112.9 | | 12 day DMA | 111.94 | | 20 day DMA | 111.25 | | 35 day DMA | 109.52 | | 50 day DMA | 107.05 | | 100 day DMA | 101.42 | | 150 day DMA | 95.09 | | 200 day DMA | 92.35 | EMA (exponential moving average) of Nathan S NATH
| EMA period | EMA current | EMA prev | EMA prev2 | | 5 day EMA | 111.31 | 114.36 | 113.66 | | 12 day EMA | 111.73 | 112.92 | 112.4 | | 20 day EMA | 111.05 | 111.67 | 111.24 | | 35 day EMA | 108.86 | 109.08 | 108.69 | | 50 day EMA | 106.79 | 106.85 | 106.49 |
SMA (simple moving average) of Nathan S NATH
| SMA period | SMA current | SMA prev | SMA prev2 | | 5 day SMA | 112.9 | 114.51 | 114.01 | | 12 day SMA | 111.94 | 112.04 | 111.55 | | 20 day SMA | 111.25 | 111.69 | 111.67 | | 35 day SMA | 109.52 | 109.42 | 109.06 | | 50 day SMA | 107.05 | 106.9 | 106.55 | | 100 day SMA | 101.42 | 101.36 | 101.19 | | 150 day SMA | 95.09 | 94.98 | 94.77 | | 200 day SMA | 92.35 | 92.23 | 92.05 |
|
|
