MmtecInc MTC full analysis,charts,indicators,moving averages,SMA,DMA,EMA,ADX,MACD,RSIMmtec Inc MTC WideScreen charts, DMA,SMA,EMA technical analysis, forecast prediction, by indicators ADX,MACD,RSI,CCI NASDAQ stock exchange
operates under N A sector & deals in N A
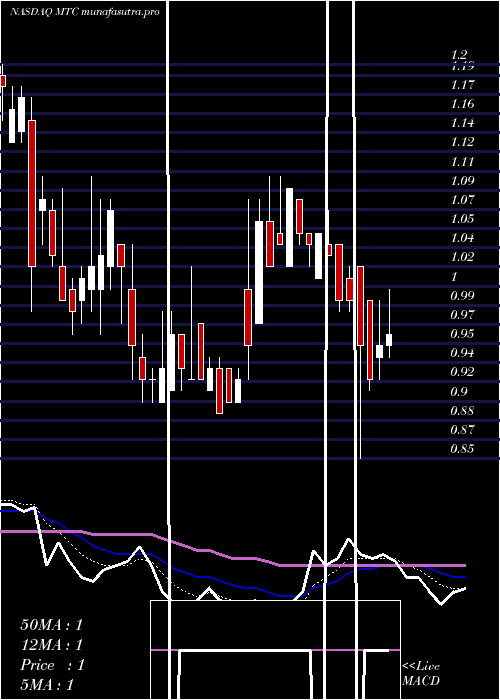
Daily price and charts and targets MmtecInc Strong Daily Stock price targets for MmtecInc MTC are 0.96 and 0.99 | Daily Target 1 | 0.93 | | Daily Target 2 | 0.95 | | Daily Target 3 | 0.96 | | Daily Target 4 | 0.98 | | Daily Target 5 | 0.99 |
Daily price and volume Mmtec Inc
| Date |
Closing |
Open |
Range |
Volume |
Tue 29 July 2025 |
0.97 (3.19%) |
0.95 |
0.94 - 0.97 |
0.4863 times |
Mon 28 July 2025 |
0.94 (-3.09%) |
0.97 |
0.94 - 0.98 |
0.2871 times |
Fri 25 July 2025 |
0.97 (0%) |
0.97 |
0.94 - 0.99 |
1.2402 times |
Thu 24 July 2025 |
0.97 (-1.02%) |
0.96 |
0.90 - 0.98 |
1.1562 times |
Wed 23 July 2025 |
0.98 (8.89%) |
0.94 |
0.92 - 0.98 |
1.3574 times |
Tue 22 July 2025 |
0.90 (2.27%) |
0.92 |
0.86 - 0.92 |
0.8652 times |
Mon 21 July 2025 |
0.88 (-6.38%) |
0.89 |
0.88 - 0.94 |
1.7949 times |
Fri 18 July 2025 |
0.94 (3.3%) |
0.95 |
0.91 - 0.96 |
0.6438 times |
Thu 17 July 2025 |
0.91 (-5.21%) |
0.93 |
0.91 - 0.96 |
1.1435 times |
Wed 16 July 2025 |
0.96 (1.05%) |
0.95 |
0.94 - 1.00 |
1.0254 times |
Tue 15 July 2025 |
0.95 (3.26%) |
0.94 |
0.92 - 0.99 |
0.8808 times |
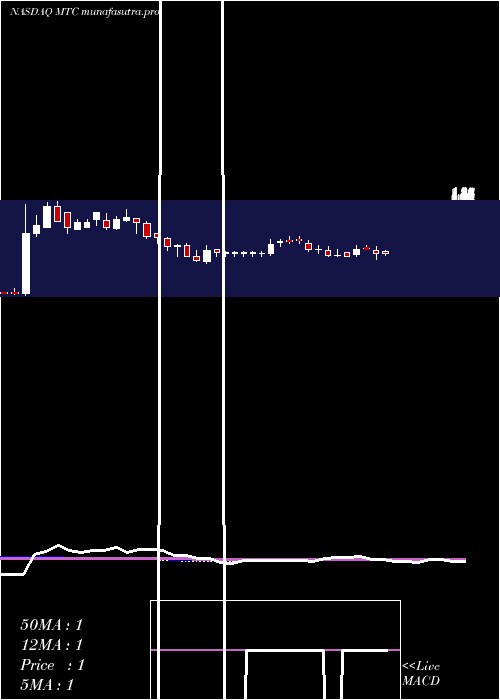
Weekly price and charts MmtecInc Strong weekly Stock price targets for MmtecInc MTC are 0.95 and 0.99 | Weekly Target 1 | 0.92 | | Weekly Target 2 | 0.95 | | Weekly Target 3 | 0.96333333333333 | | Weekly Target 4 | 0.99 | | Weekly Target 5 | 1 |
Weekly price and volumes for Mmtec Inc
| Date |
Closing |
Open |
Range |
Volume |
Tue 29 July 2025 |
0.97 (0%) |
0.97 |
0.94 - 0.98 |
0.1274 times |
Fri 25 July 2025 |
0.97 (3.19%) |
0.89 |
0.86 - 0.99 |
1.0561 times |
Fri 18 July 2025 |
0.94 (-1.05%) |
0.99 |
0.91 - 1.00 |
0.7281 times |
Fri 11 July 2025 |
0.95 (-8.65%) |
1.01 |
0.85 - 1.07 |
1.7479 times |
Thu 03 July 2025 |
1.04 (1.96%) |
1.05 |
1.02 - 1.10 |
0.6442 times |
Fri 27 June 2025 |
1.02 (14.61%) |
0.93 |
0.90 - 1.10 |
2.0669 times |
Fri 20 June 2025 |
0.89 (-3.26%) |
0.97 |
0.89 - 0.97 |
0.2907 times |
Fri 13 June 2025 |
0.92 (0%) |
0.92 |
0.90 - 1.02 |
0.8596 times |
Fri 06 June 2025 |
0.92 (-9.8%) |
1.00 |
0.90 - 1.08 |
1.6839 times |
Fri 30 May 2025 |
1.02 (-0.97%) |
1.02 |
0.96 - 1.10 |
0.7953 times |
Fri 23 May 2025 |
1.03 (-12.71%) |
1.13 |
0.98 - 1.18 |
1.58 times |
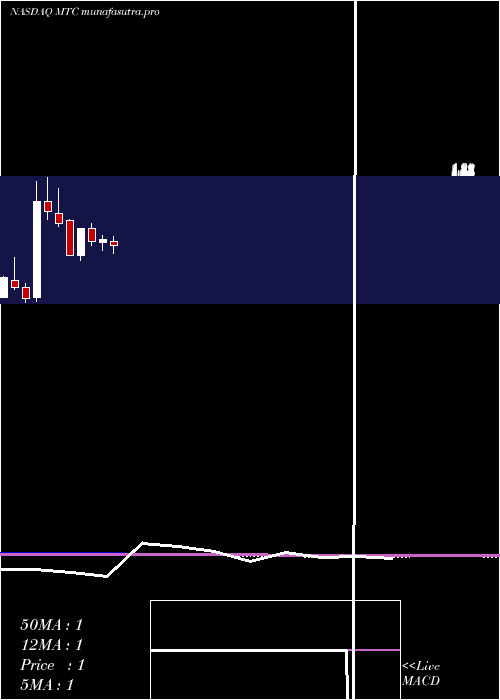
Monthly price and charts MmtecInc Strong monthly Stock price targets for MmtecInc MTC are 0.79 and 1.03 | Monthly Target 1 | 0.73 | | Monthly Target 2 | 0.85 | | Monthly Target 3 | 0.97 | | Monthly Target 4 | 1.09 | | Monthly Target 5 | 1.21 |
Monthly price and volumes Mmtec Inc
| Date |
Closing |
Open |
Range |
Volume |
Tue 29 July 2025 |
0.97 (-6.73%) |
1.02 |
0.85 - 1.09 |
0.0372 times |
Mon 30 June 2025 |
1.04 (1.96%) |
1.00 |
0.89 - 1.10 |
0.0466 times |
Fri 30 May 2025 |
1.02 (-15%) |
1.20 |
0.96 - 1.27 |
0.0372 times |
Wed 30 April 2025 |
1.20 (46.34%) |
0.82 |
0.76 - 1.20 |
0.0519 times |
Mon 31 March 2025 |
0.82 (-34.92%) |
1.31 |
0.82 - 1.32 |
0.0624 times |
Fri 28 February 2025 |
1.26 (-11.89%) |
1.41 |
1.23 - 1.75 |
0.0804 times |
Fri 31 January 2025 |
1.43 (-8.92%) |
1.57 |
1.32 - 1.90 |
0.1046 times |
Tue 31 December 2024 |
1.57 (582.61%) |
0.24 |
0.19 - 1.85 |
1.1779 times |
Tue 26 November 2024 |
0.23 (-39.47%) |
0.38 |
0.18 - 0.44 |
2.1466 times |
Thu 31 October 2024 |
0.38 (-26.92%) |
0.48 |
0.35 - 0.80 |
6.2553 times |
Mon 30 September 2024 |
0.52 (92.59%) |
0.28 |
0.24 - 0.53 |
1.9175 times |
DMA SMA EMA moving averages of Mmtec Inc MTC
DMA (daily moving average) of Mmtec Inc MTC
| DMA period | DMA value | | 5 day DMA | 0.97 | | 12 day DMA | 0.94 | | 20 day DMA | 0.97 | | 35 day DMA | 0.96 | | 50 day DMA | 0.99 | | 100 day DMA | 1.02 | | 150 day DMA | 1.17 | | 200 day DMA | 0.99 | EMA (exponential moving average) of Mmtec Inc MTC
| EMA period | EMA current | EMA prev | EMA prev2 | | 5 day EMA | 0.96 | 0.95 | 0.95 | | 12 day EMA | 0.95 | 0.95 | 0.95 | | 20 day EMA | 0.96 | 0.96 | 0.96 | | 35 day EMA | 0.99 | 0.99 | 0.99 | | 50 day EMA | 1.01 | 1.01 | 1.01 |
SMA (simple moving average) of Mmtec Inc MTC
| SMA period | SMA current | SMA prev | SMA prev2 | | 5 day SMA | 0.97 | 0.95 | 0.94 | | 12 day SMA | 0.94 | 0.94 | 0.94 | | 20 day SMA | 0.97 | 0.98 | 0.98 | | 35 day SMA | 0.96 | 0.96 | 0.96 | | 50 day SMA | 0.99 | 1 | 1 | | 100 day SMA | 1.02 | 1.02 | 1.02 | | 150 day SMA | 1.17 | 1.18 | 1.18 | | 200 day SMA | 0.99 | 0.99 | 0.99 |
|
|
