MainstreetBancshares MNSBP full analysis,charts,indicators,moving averages,SMA,DMA,EMA,ADX,MACD,RSIMainstreet Bancshares MNSBP WideScreen charts, DMA,SMA,EMA technical analysis, forecast prediction, by indicators ADX,MACD,RSI,CCI NASDAQ stock exchange
Daily price and charts and targets MainstreetBancshares Strong Daily Stock price targets for MainstreetBancshares MNSBP are 24.6 and 24.69 | Daily Target 1 | 24.53 | | Daily Target 2 | 24.57 | | Daily Target 3 | 24.62 | | Daily Target 4 | 24.66 | | Daily Target 5 | 24.71 |
Daily price and volume Mainstreet Bancshares
| Date |
Closing |
Open |
Range |
Volume |
Tue 21 October 2025 |
24.61 (-1.12%) |
24.58 |
24.58 - 24.67 |
1.2658 times |
Mon 20 October 2025 |
24.89 (0.73%) |
24.86 |
24.86 - 24.89 |
0.2532 times |
Fri 17 October 2025 |
24.71 (-0.04%) |
24.55 |
24.55 - 24.71 |
0.3797 times |
Thu 16 October 2025 |
24.72 (0.69%) |
24.79 |
24.72 - 24.79 |
0.3797 times |
Wed 15 October 2025 |
24.55 (0%) |
24.55 |
24.55 - 24.55 |
0.2532 times |
Tue 14 October 2025 |
24.55 (-0.08%) |
24.59 |
24.55 - 24.59 |
0.8861 times |
Mon 13 October 2025 |
24.57 (-1.21%) |
24.94 |
24.57 - 24.94 |
4.3038 times |
Fri 10 October 2025 |
24.87 (0.48%) |
24.87 |
24.87 - 24.87 |
0.2532 times |
Thu 09 October 2025 |
24.75 (-0.56%) |
24.77 |
24.75 - 24.77 |
1.2658 times |
Tue 07 October 2025 |
24.89 (-0.56%) |
24.89 |
24.89 - 24.89 |
0.7595 times |
Mon 06 October 2025 |
25.03 (0.48%) |
25.03 |
25.03 - 25.03 |
0.5063 times |
Weekly price and charts MainstreetBancshares Strong weekly Stock price targets for MainstreetBancshares MNSBP are 24.44 and 24.75 | Weekly Target 1 | 24.38 | | Weekly Target 2 | 24.5 | | Weekly Target 3 | 24.693333333333 | | Weekly Target 4 | 24.81 | | Weekly Target 5 | 25 |
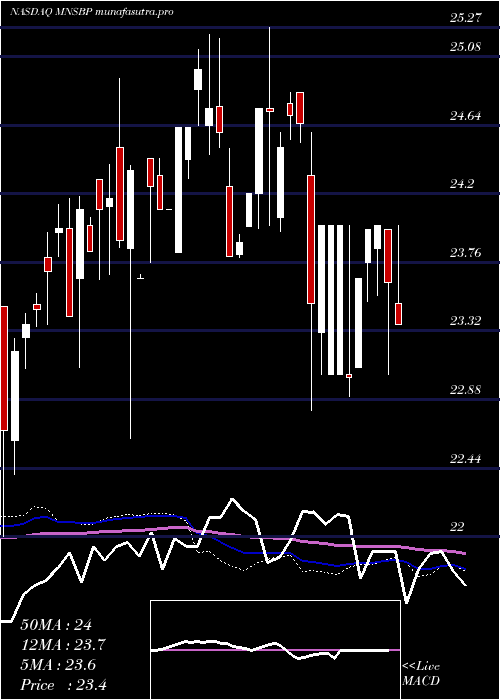
Weekly price and volumes for Mainstreet Bancshares
| Date |
Closing |
Open |
Range |
Volume |
Tue 21 October 2025 |
24.61 (-0.4%) |
24.86 |
24.58 - 24.89 |
0.2424 times |
Fri 17 October 2025 |
24.71 (-0.64%) |
24.94 |
24.55 - 24.94 |
0.9899 times |
Fri 10 October 2025 |
24.87 (-0.16%) |
25.03 |
24.75 - 25.03 |
0.4444 times |
Fri 03 October 2025 |
24.91 (-0.95%) |
25.17 |
24.82 - 25.17 |
0.7273 times |
Fri 26 September 2025 |
25.15 (0.8%) |
24.95 |
24.59 - 25.17 |
1.2525 times |
Fri 19 September 2025 |
24.95 (-0.2%) |
24.50 |
24.17 - 25.10 |
2.5455 times |
Fri 12 September 2025 |
25.00 (5.26%) |
23.71 |
23.71 - 25.20 |
1.5758 times |
Fri 05 September 2025 |
23.75 (-1.25%) |
24.05 |
23.30 - 24.51 |
1.2525 times |
Fri 29 August 2025 |
24.05 (0%) |
24.07 |
24.05 - 24.07 |
0.0606 times |
Fri 29 August 2025 |
24.05 (-3.18%) |
24.21 |
24.05 - 24.85 |
0.9091 times |
Fri 22 August 2025 |
24.84 (-1.08%) |
25.18 |
24.05 - 25.18 |
0.5253 times |
Monthly price and charts MainstreetBancshares Strong monthly Stock price targets for MainstreetBancshares MNSBP are 24.31 and 24.85 | Monthly Target 1 | 24.21 | | Monthly Target 2 | 24.41 | | Monthly Target 3 | 24.75 | | Monthly Target 4 | 24.95 | | Monthly Target 5 | 25.29 |
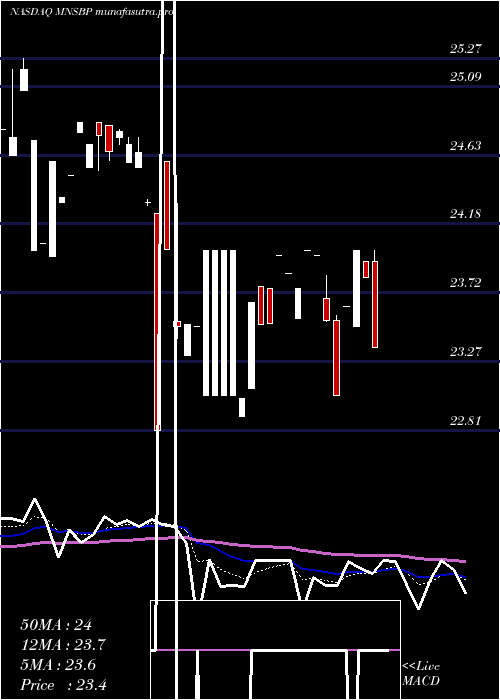
Monthly price and volumes Mainstreet Bancshares
| Date |
Closing |
Open |
Range |
Volume |
Tue 21 October 2025 |
24.61 (-2.22%) |
24.82 |
24.55 - 25.09 |
0.4222 times |
Tue 30 September 2025 |
25.17 (4.66%) |
24.05 |
23.30 - 25.20 |
1.2479 times |
Fri 29 August 2025 |
24.05 (-0.25%) |
25.00 |
23.32 - 25.20 |
0.6352 times |
Wed 30 July 2025 |
24.11 (-0.37%) |
24.20 |
23.71 - 28.25 |
2.4546 times |
Mon 30 June 2025 |
24.20 (1.47%) |
23.78 |
23.06 - 24.20 |
0.4558 times |
Thu 29 May 2025 |
23.85 (1.4%) |
23.97 |
23.04 - 24.00 |
0.7846 times |
Wed 30 April 2025 |
23.52 (-5.01%) |
24.83 |
22.81 - 24.83 |
1.3717 times |
Mon 31 March 2025 |
24.76 (2.31%) |
24.20 |
23.96 - 25.27 |
1.2904 times |
Tue 25 February 2025 |
24.20 (-2.22%) |
24.76 |
23.79 - 25.20 |
0.4446 times |
Fri 31 January 2025 |
24.75 (2.36%) |
24.25 |
23.82 - 25.22 |
0.893 times |
Tue 31 December 2024 |
24.18 (0.04%) |
24.50 |
22.63 - 24.94 |
0.8237 times |

DMA SMA EMA moving averages of Mainstreet Bancshares MNSBP
DMA (daily moving average) of Mainstreet Bancshares MNSBP
| DMA period | DMA value | | 5 day DMA | 24.7 | | 12 day DMA | 24.75 | | 20 day DMA | 24.85 | | 35 day DMA | 24.62 | | 50 day DMA | 24.64 | | 100 day DMA | 24.32 | | 150 day DMA | 24.35 | | 200 day DMA | 24.26 | EMA (exponential moving average) of Mainstreet Bancshares MNSBP
| EMA period | EMA current | EMA prev | EMA prev2 | | 5 day EMA | 24.7 | 24.75 | 24.68 | | 12 day EMA | 24.74 | 24.76 | 24.74 | | 20 day EMA | 24.75 | 24.76 | 24.75 | | 35 day EMA | 24.7 | 24.71 | 24.7 | | 50 day EMA | 24.63 | 24.63 | 24.62 |
SMA (simple moving average) of Mainstreet Bancshares MNSBP
| SMA period | SMA current | SMA prev | SMA prev2 | | 5 day SMA | 24.7 | 24.68 | 24.62 | | 12 day SMA | 24.75 | 24.79 | 24.8 | | 20 day SMA | 24.85 | 24.86 | 24.86 | | 35 day SMA | 24.62 | 24.62 | 24.62 | | 50 day SMA | 24.64 | 24.63 | 24.63 | | 100 day SMA | 24.32 | 24.31 | 24.3 | | 150 day SMA | 24.35 | 24.35 | 24.35 | | 200 day SMA | 24.26 | 24.26 | 24.25 |
|
|
