MesaLaboratories MLAB full analysis,charts,indicators,moving averages,SMA,DMA,EMA,ADX,MACD,RSIMesa Laboratories MLAB WideScreen charts, DMA,SMA,EMA technical analysis, forecast prediction, by indicators ADX,MACD,RSI,CCI NASDAQ stock exchange
operates under Capital Goods sector & deals in Industrial Machinery Components
Daily price and charts and targets MesaLaboratories Strong Daily Stock price targets for MesaLaboratories MLAB are 84.93 and 87.77 | Daily Target 1 | 84.43 | | Daily Target 2 | 85.42 | | Daily Target 3 | 87.266666666667 | | Daily Target 4 | 88.26 | | Daily Target 5 | 90.11 |
Daily price and volume Mesa Laboratories
| Date |
Closing |
Open |
Range |
Volume |
Fri 11 July 2025 |
86.42 (-4.31%) |
89.11 |
86.27 - 89.11 |
0.7506 times |
Thu 10 July 2025 |
90.31 (-0.53%) |
91.04 |
89.96 - 95.14 |
0.7172 times |
Wed 09 July 2025 |
90.79 (-1.34%) |
92.50 |
90.15 - 92.50 |
0.4482 times |
Tue 08 July 2025 |
92.02 (-0.99%) |
92.94 |
91.53 - 95.29 |
0.6086 times |
Mon 07 July 2025 |
92.94 (-10.12%) |
101.60 |
90.83 - 102.43 |
1.447 times |
Thu 03 July 2025 |
103.40 (2.75%) |
100.90 |
99.54 - 103.73 |
0.3344 times |
Wed 02 July 2025 |
100.63 (2.99%) |
98.05 |
97.06 - 100.75 |
0.9168 times |
Tue 01 July 2025 |
97.71 (3.7%) |
94.22 |
93.57 - 101.11 |
1.0036 times |
Mon 30 June 2025 |
94.22 (-4.51%) |
98.74 |
94.08 - 98.91 |
1.4499 times |
Fri 27 June 2025 |
98.67 (2.4%) |
97.04 |
95.44 - 99.86 |
2.3236 times |
Thu 26 June 2025 |
96.36 (-1.66%) |
98.95 |
95.21 - 101.18 |
2.3711 times |
Weekly price and charts MesaLaboratories Strong weekly Stock price targets for MesaLaboratories MLAB are 78.27 and 94.43 | Weekly Target 1 | 75.55 | | Weekly Target 2 | 80.98 | | Weekly Target 3 | 91.706666666667 | | Weekly Target 4 | 97.14 | | Weekly Target 5 | 107.87 |
Weekly price and volumes for Mesa Laboratories
| Date |
Closing |
Open |
Range |
Volume |
Fri 11 July 2025 |
86.42 (-16.42%) |
101.60 |
86.27 - 102.43 |
1.3006 times |
Thu 03 July 2025 |
103.40 (4.79%) |
98.74 |
93.57 - 103.73 |
1.2132 times |
Fri 27 June 2025 |
98.67 (2.97%) |
95.16 |
93.01 - 101.23 |
2.7444 times |
Fri 20 June 2025 |
95.82 (-1.32%) |
95.09 |
87.80 - 96.27 |
0.9726 times |
Fri 13 June 2025 |
97.10 (-6.63%) |
106.40 |
96.87 - 106.40 |
1.3016 times |
Fri 06 June 2025 |
103.99 (3.35%) |
100.86 |
96.54 - 104.19 |
1.2175 times |
Fri 30 May 2025 |
100.62 (-8.4%) |
111.38 |
98.06 - 115.35 |
0.3288 times |
Fri 23 May 2025 |
109.85 (-10.27%) |
119.55 |
108.25 - 122.20 |
0.2971 times |
Fri 16 May 2025 |
122.42 (-1.15%) |
130.46 |
114.52 - 131.20 |
0.3894 times |
Fri 09 May 2025 |
123.84 (4.01%) |
118.17 |
116.81 - 128.55 |
0.2349 times |
Fri 02 May 2025 |
119.06 (2.21%) |
116.72 |
112.38 - 120.05 |
0.2131 times |
Monthly price and charts MesaLaboratories Strong monthly Stock price targets for MesaLaboratories MLAB are 77.62 and 95.08 | Monthly Target 1 | 74.68 | | Monthly Target 2 | 80.55 | | Monthly Target 3 | 92.14 | | Monthly Target 4 | 98.01 | | Monthly Target 5 | 109.6 |
Monthly price and volumes Mesa Laboratories
| Date |
Closing |
Open |
Range |
Volume |
Fri 11 July 2025 |
86.42 (-8.28%) |
94.22 |
86.27 - 103.73 |
1.0956 times |
Mon 30 June 2025 |
94.22 (-6.36%) |
100.86 |
87.80 - 106.40 |
3.6059 times |
Fri 30 May 2025 |
100.62 (-12.69%) |
115.34 |
98.06 - 131.20 |
0.7121 times |
Wed 30 April 2025 |
115.25 (-2.87%) |
117.85 |
97.20 - 121.91 |
0.843 times |
Mon 31 March 2025 |
118.66 (-14.87%) |
139.09 |
114.67 - 142.19 |
0.7619 times |
Fri 28 February 2025 |
139.38 (1.23%) |
132.88 |
132.50 - 155.12 |
0.5721 times |
Fri 31 January 2025 |
137.69 (4.41%) |
132.40 |
125.70 - 149.50 |
0.5714 times |
Tue 31 December 2024 |
131.87 (13.24%) |
124.90 |
121.03 - 138.00 |
0.5634 times |
Tue 26 November 2024 |
116.45 (2.11%) |
115.36 |
97.90 - 140.54 |
0.707 times |
Thu 31 October 2024 |
114.04 (-12.18%) |
129.34 |
110.71 - 136.23 |
0.5675 times |
Mon 30 September 2024 |
129.86 (-2.86%) |
132.24 |
116.59 - 133.58 |
0.6061 times |
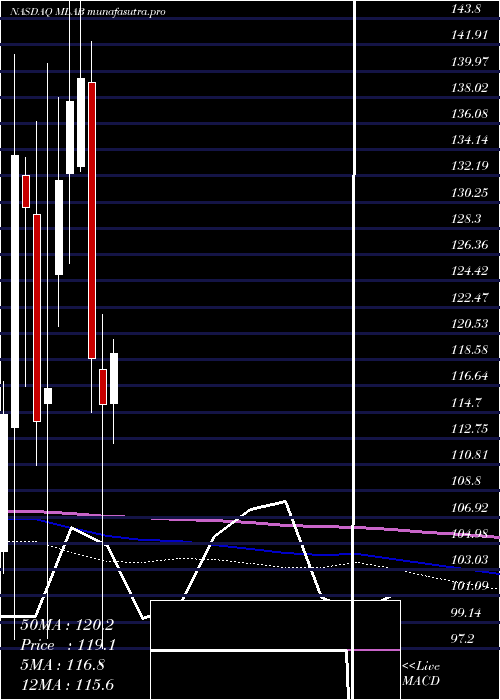
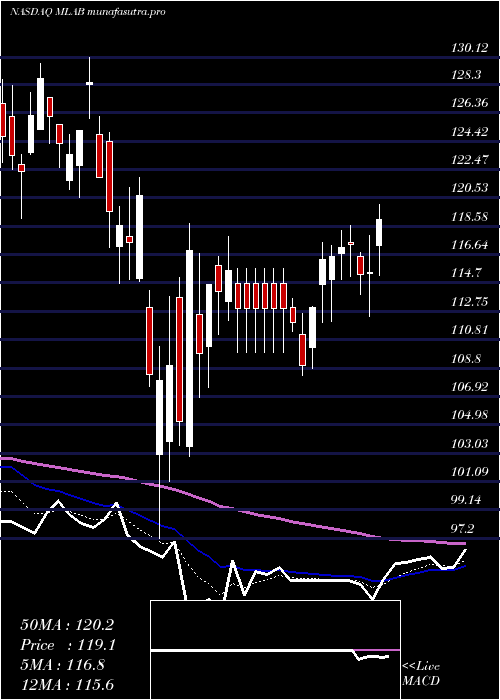
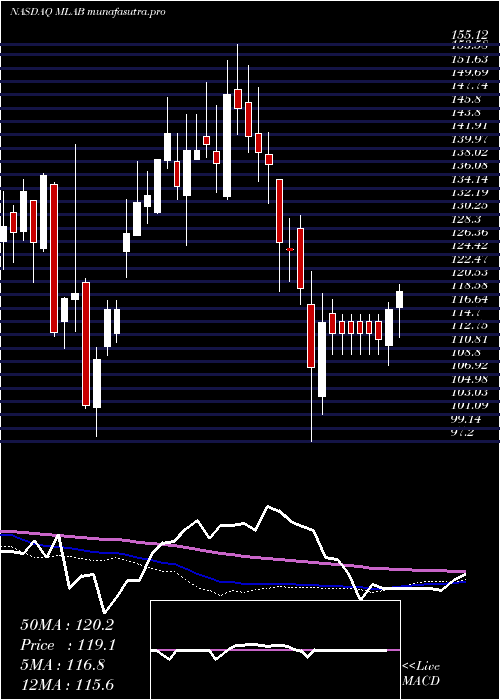
DMA SMA EMA moving averages of Mesa Laboratories MLAB
DMA (daily moving average) of Mesa Laboratories MLAB
| DMA period | DMA value | | 5 day DMA | 90.5 | | 12 day DMA | 95.12 | | 20 day DMA | 96.05 | | 35 day DMA | 100.02 | | 50 day DMA | 106.23 | | 100 day DMA | 114.83 | | 150 day DMA | 122.27 | | 200 day DMA | 121.95 | EMA (exponential moving average) of Mesa Laboratories MLAB
| EMA period | EMA current | EMA prev | EMA prev2 | | 5 day EMA | 90.69 | 92.82 | 94.08 | | 12 day EMA | 93.93 | 95.3 | 96.21 | | 20 day EMA | 96.28 | 97.32 | 98.06 | | 35 day EMA | 100.95 | 101.81 | 102.49 | | 50 day EMA | 105.32 | 106.09 | 106.73 |
SMA (simple moving average) of Mesa Laboratories MLAB
| SMA period | SMA current | SMA prev | SMA prev2 | | 5 day SMA | 90.5 | 93.89 | 95.96 | | 12 day SMA | 95.12 | 96.14 | 96.77 | | 20 day SMA | 96.05 | 96.95 | 97.57 | | 35 day SMA | 100.02 | 100.94 | 101.86 | | 50 day SMA | 106.23 | 106.84 | 107.36 | | 100 day SMA | 114.83 | 115.42 | 115.97 | | 150 day SMA | 122.27 | 122.47 | 122.63 | | 200 day SMA | 121.95 | 122.13 | 122.3 |
|
|
