MaidenHoldings MHLD full analysis,charts,indicators,moving averages,SMA,DMA,EMA,ADX,MACD,RSIMaiden Holdings MHLD WideScreen charts, DMA,SMA,EMA technical analysis, forecast prediction, by indicators ADX,MACD,RSI,CCI NASDAQ stock exchange
operates under Finance sector & deals in Property Casualty Insurers
Daily price and charts and targets MaidenHoldings Strong Daily Stock price targets for MaidenHoldings MHLD are 1.09 and 1.36 | Daily Target 1 | 0.88 | | Daily Target 2 | 1.02 | | Daily Target 3 | 1.1533333333333 | | Daily Target 4 | 1.29 | | Daily Target 5 | 1.42 |
Daily price and volume Maiden Holdings
| Date |
Closing |
Open |
Range |
Volume |
Tue 27 May 2025 |
1.15 (15%) |
1.02 |
1.02 - 1.29 |
2.3679 times |
Fri 23 May 2025 |
1.00 (-3.85%) |
0.99 |
0.99 - 1.06 |
1.2403 times |
Thu 22 May 2025 |
1.04 (-7.96%) |
1.10 |
1.04 - 1.17 |
0.929 times |
Wed 21 May 2025 |
1.13 (-4.24%) |
1.15 |
1.09 - 1.20 |
0.8355 times |
Tue 20 May 2025 |
1.18 (-1.67%) |
1.17 |
1.16 - 1.24 |
0.6494 times |
Mon 19 May 2025 |
1.20 (-3.23%) |
1.20 |
1.16 - 1.26 |
0.8489 times |
Fri 16 May 2025 |
1.24 (-3.88%) |
1.29 |
1.22 - 1.36 |
0.9655 times |
Thu 15 May 2025 |
1.29 (6.61%) |
1.20 |
1.20 - 1.32 |
0.883 times |
Wed 14 May 2025 |
1.21 (0.83%) |
1.17 |
1.16 - 1.24 |
0.8422 times |
Tue 13 May 2025 |
1.20 (2.56%) |
1.25 |
1.15 - 1.25 |
0.4384 times |
Mon 12 May 2025 |
1.17 (-2.5%) |
1.22 |
1.11 - 1.24 |
1.3453 times |
Weekly price and charts MaidenHoldings Strong weekly Stock price targets for MaidenHoldings MHLD are 1.09 and 1.36 | Weekly Target 1 | 0.88 | | Weekly Target 2 | 1.02 | | Weekly Target 3 | 1.1533333333333 | | Weekly Target 4 | 1.29 | | Weekly Target 5 | 1.42 |
Weekly price and volumes for Maiden Holdings
| Date |
Closing |
Open |
Range |
Volume |
Tue 27 May 2025 |
1.15 (15%) |
1.02 |
1.02 - 1.29 |
0.8841 times |
Fri 23 May 2025 |
1.00 (-19.35%) |
1.20 |
0.99 - 1.26 |
1.6813 times |
Fri 16 May 2025 |
1.24 (3.33%) |
1.22 |
1.11 - 1.36 |
1.6705 times |
Fri 09 May 2025 |
1.20 (-9.77%) |
1.30 |
1.18 - 1.32 |
1.2102 times |
Fri 02 May 2025 |
1.33 (13.68%) |
1.19 |
1.12 - 1.43 |
2.2518 times |
Fri 25 April 2025 |
1.17 (21.88%) |
0.95 |
0.94 - 1.19 |
1.5003 times |
Thu 17 April 2025 |
0.96 (1.05%) |
1.03 |
0.91 - 1.07 |
0.4307 times |
Wed 16 April 2025 |
0.95 (0%) |
1.03 |
0.93 - 1.07 |
0.3712 times |
Wed 16 April 2025 |
0.95 (0%) |
1.03 |
0.93 - 1.07 |
0 times |
Wed 16 April 2025 |
0.95 (0%) |
1.03 |
0.93 - 1.07 |
0 times |
Wed 16 April 2025 |
0.95 (-5%) |
1.00 |
0.93 - 1.08 |
0.556 times |

Monthly price and charts MaidenHoldings Strong monthly Stock price targets for MaidenHoldings MHLD are 0.86 and 1.29 | Monthly Target 1 | 0.76 | | Monthly Target 2 | 0.95 | | Monthly Target 3 | 1.1866666666667 | | Monthly Target 4 | 1.38 | | Monthly Target 5 | 1.62 |
Monthly price and volumes Maiden Holdings
| Date |
Closing |
Open |
Range |
Volume |
Tue 27 May 2025 |
1.15 (-17.86%) |
1.41 |
0.99 - 1.42 |
1.1068 times |
Wed 30 April 2025 |
1.40 (145.61%) |
0.58 |
0.55 - 1.43 |
1.6118 times |
Mon 31 March 2025 |
0.57 (-41.24%) |
0.97 |
0.57 - 1.01 |
1.091 times |
Fri 28 February 2025 |
0.97 (-3.96%) |
1.00 |
0.80 - 1.06 |
0.927 times |
Fri 31 January 2025 |
1.01 (-40.24%) |
1.65 |
1.00 - 1.65 |
1.0396 times |
Tue 31 December 2024 |
1.69 (7.64%) |
1.40 |
1.22 - 1.71 |
1.4583 times |
Tue 26 November 2024 |
1.57 (1.29%) |
1.58 |
1.54 - 1.95 |
0.6038 times |
Thu 31 October 2024 |
1.55 (-12.43%) |
1.76 |
1.54 - 1.83 |
0.5048 times |
Mon 30 September 2024 |
1.77 (-0.56%) |
1.77 |
1.44 - 1.85 |
1.1515 times |
Fri 30 August 2024 |
1.78 (-15.64%) |
2.09 |
1.58 - 2.11 |
0.5054 times |
Wed 31 July 2024 |
2.11 (2.43%) |
2.04 |
1.73 - 2.14 |
0.6959 times |

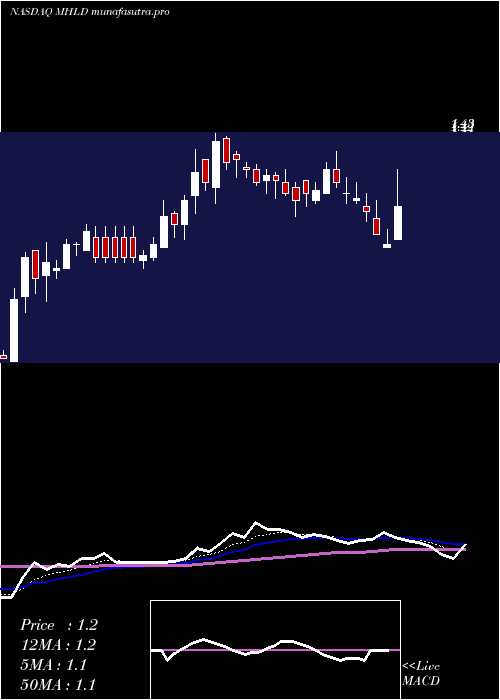
DMA SMA EMA moving averages of Maiden Holdings MHLD
DMA (daily moving average) of Maiden Holdings MHLD
| DMA period | DMA value | | 5 day DMA | 1.1 | | 12 day DMA | 1.17 | | 20 day DMA | 1.22 | | 35 day DMA | 1.13 | | 50 day DMA | 1.01 | | 100 day DMA | 1 | | 150 day DMA | 1.19 | | 200 day DMA | 1.32 | EMA (exponential moving average) of Maiden Holdings MHLD
| EMA period | EMA current | EMA prev | EMA prev2 | | 5 day EMA | 1.11 | 1.09 | 1.13 | | 12 day EMA | 1.15 | 1.15 | 1.18 | | 20 day EMA | 1.15 | 1.15 | 1.17 | | 35 day EMA | 1.09 | 1.09 | 1.1 | | 50 day EMA | 1.01 | 1 | 1 |
SMA (simple moving average) of Maiden Holdings MHLD
| SMA period | SMA current | SMA prev | SMA prev2 | | 5 day SMA | 1.1 | 1.11 | 1.16 | | 12 day SMA | 1.17 | 1.18 | 1.2 | | 20 day SMA | 1.22 | 1.22 | 1.23 | | 35 day SMA | 1.13 | 1.13 | 1.12 | | 50 day SMA | 1.01 | 1 | 0.99 | | 100 day SMA | 1 | 1 | 1.01 | | 150 day SMA | 1.19 | 1.2 | 1.2 | | 200 day SMA | 1.32 | 1.32 | 1.33 |
|
|
