McgrathRentcorp MGRC full analysis,charts,indicators,moving averages,SMA,DMA,EMA,ADX,MACD,RSIMcgrath Rentcorp MGRC WideScreen charts, DMA,SMA,EMA technical analysis, forecast prediction, by indicators ADX,MACD,RSI,CCI NASDAQ stock exchange
operates under Technology sector & deals in Diversified Commercial Services
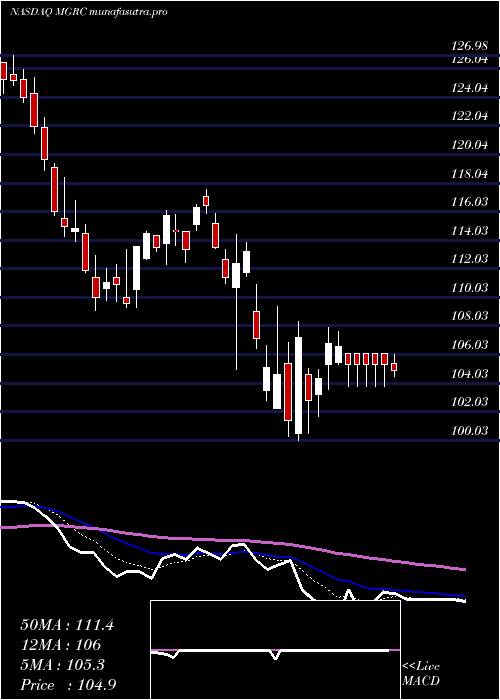
Daily price and charts and targets McgrathRentcorp Strong Daily Stock price targets for McgrathRentcorp MGRC are 101.39 and 103.98 | Daily Target 1 | 100.82 | | Daily Target 2 | 101.96 | | Daily Target 3 | 103.40666666667 | | Daily Target 4 | 104.55 | | Daily Target 5 | 106 |
Daily price and volume Mcgrath Rentcorp
| Date |
Closing |
Open |
Range |
Volume |
Fri 05 December 2025 |
103.11 (-0.2%) |
103.36 |
102.26 - 104.85 |
0.6971 times |
Thu 04 December 2025 |
103.32 (-1.05%) |
103.93 |
103.12 - 104.30 |
0.6005 times |
Wed 03 December 2025 |
104.42 (3.33%) |
101.84 |
101.33 - 105.32 |
0.7287 times |
Tue 02 December 2025 |
101.05 (-0.91%) |
102.14 |
100.70 - 102.28 |
1.0387 times |
Mon 01 December 2025 |
101.98 (-1.07%) |
102.40 |
101.13 - 103.81 |
1.1353 times |
Fri 28 November 2025 |
103.08 (-0.77%) |
103.55 |
102.51 - 103.55 |
0.4934 times |
Wed 26 November 2025 |
103.88 (-0.34%) |
103.73 |
102.24 - 104.70 |
1.2927 times |
Tue 25 November 2025 |
104.23 (4.58%) |
100.13 |
99.69 - 104.45 |
1.5905 times |
Mon 24 November 2025 |
99.67 (-0.31%) |
99.44 |
98.65 - 100.07 |
1.4485 times |
Fri 21 November 2025 |
99.98 (4.27%) |
96.15 |
96.13 - 101.05 |
0.9746 times |
Thu 20 November 2025 |
95.89 (-0.14%) |
97.51 |
95.47 - 98.22 |
0.8983 times |
Weekly price and charts McgrathRentcorp Strong weekly Stock price targets for McgrathRentcorp MGRC are 101.91 and 106.53 | Weekly Target 1 | 98.42 | | Weekly Target 2 | 100.77 | | Weekly Target 3 | 103.04333333333 | | Weekly Target 4 | 105.39 | | Weekly Target 5 | 107.66 |
Weekly price and volumes for Mcgrath Rentcorp
| Date |
Closing |
Open |
Range |
Volume |
Fri 05 December 2025 |
103.11 (0.03%) |
102.40 |
100.70 - 105.32 |
0.9844 times |
Fri 28 November 2025 |
103.08 (3.1%) |
99.44 |
98.65 - 104.70 |
1.1309 times |
Fri 21 November 2025 |
99.98 (-1.47%) |
101.73 |
94.99 - 101.73 |
1.183 times |
Fri 14 November 2025 |
101.47 (-3.01%) |
105.02 |
100.43 - 106.56 |
1.0449 times |
Fri 07 November 2025 |
104.62 (-2.62%) |
108.58 |
104.01 - 108.82 |
0.7273 times |
Fri 31 October 2025 |
107.44 (0%) |
108.80 |
107.04 - 110.08 |
0.299 times |
Fri 31 October 2025 |
107.44 (-6.17%) |
114.34 |
107.04 - 115.41 |
1.6387 times |
Fri 24 October 2025 |
114.50 (-3.74%) |
118.55 |
109.26 - 123.20 |
1.1139 times |
Fri 17 October 2025 |
118.95 (4.34%) |
114.77 |
113.41 - 120.61 |
0.9346 times |
Fri 10 October 2025 |
114.00 (-1.11%) |
115.60 |
112.98 - 116.87 |
0.9433 times |
Fri 03 October 2025 |
115.28 (-2.7%) |
118.67 |
114.74 - 118.86 |
1.269 times |
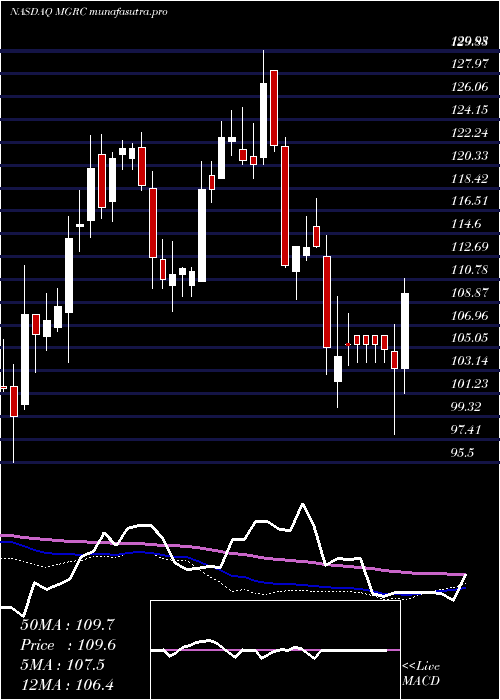
Monthly price and charts McgrathRentcorp Strong monthly Stock price targets for McgrathRentcorp MGRC are 101.91 and 106.53 | Monthly Target 1 | 98.42 | | Monthly Target 2 | 100.77 | | Monthly Target 3 | 103.04333333333 | | Monthly Target 4 | 105.39 | | Monthly Target 5 | 107.66 |
Monthly price and volumes Mcgrath Rentcorp
| Date |
Closing |
Open |
Range |
Volume |
Fri 05 December 2025 |
103.11 (0.03%) |
102.40 |
100.70 - 105.32 |
0.2025 times |
Fri 28 November 2025 |
103.08 (-4.06%) |
108.58 |
94.99 - 108.82 |
0.8406 times |
Fri 31 October 2025 |
107.44 (-8.41%) |
116.78 |
107.04 - 123.20 |
1.1695 times |
Tue 30 September 2025 |
117.30 (-3.45%) |
120.46 |
116.11 - 127.68 |
1.0836 times |
Fri 29 August 2025 |
121.49 (-2.64%) |
123.10 |
116.48 - 125.67 |
0.9599 times |
Thu 31 July 2025 |
124.79 (7.61%) |
115.53 |
112.26 - 128.41 |
1.0447 times |
Mon 30 June 2025 |
115.96 (3.19%) |
113.20 |
110.56 - 118.53 |
1.3221 times |
Fri 30 May 2025 |
112.38 (5.35%) |
106.66 |
105.20 - 117.32 |
1.0525 times |
Wed 30 April 2025 |
106.67 (-4.25%) |
110.70 |
97.81 - 114.43 |
1.2016 times |
Mon 31 March 2025 |
111.40 (-8.69%) |
121.91 |
109.09 - 122.63 |
1.1229 times |
Fri 28 February 2025 |
122.00 (-0.55%) |
121.66 |
119.18 - 129.93 |
1.2452 times |

DMA SMA EMA moving averages of Mcgrath Rentcorp MGRC
DMA (daily moving average) of Mcgrath Rentcorp MGRC
| DMA period | DMA value | | 5 day DMA | 102.78 | | 12 day DMA | 101.39 | | 20 day DMA | 101.38 | | 35 day DMA | 106.53 | | 50 day DMA | 109.44 | | 100 day DMA | 115.33 | | 150 day DMA | 115.25 | | 200 day DMA | 114.21 | EMA (exponential moving average) of Mcgrath Rentcorp MGRC
| EMA period | EMA current | EMA prev | EMA prev2 | | 5 day EMA | 102.94 | 102.86 | 102.63 | | 12 day EMA | 102.45 | 102.33 | 102.15 | | 20 day EMA | 103.25 | 103.26 | 103.25 | | 35 day EMA | 106.03 | 106.2 | 106.37 | | 50 day EMA | 109.64 | 109.91 | 110.18 |
SMA (simple moving average) of Mcgrath Rentcorp MGRC
| SMA period | SMA current | SMA prev | SMA prev2 | | 5 day SMA | 102.78 | 102.77 | 102.88 | | 12 day SMA | 101.39 | 100.76 | 100.27 | | 20 day SMA | 101.38 | 101.52 | 101.73 | | 35 day SMA | 106.53 | 106.95 | 107.4 | | 50 day SMA | 109.44 | 109.75 | 110.08 | | 100 day SMA | 115.33 | 115.47 | 115.6 | | 150 day SMA | 115.25 | 115.28 | 115.3 | | 200 day SMA | 114.21 | 114.34 | 114.45 |
|
|
