MethanexCorporation MEOH full analysis,charts,indicators,moving averages,SMA,DMA,EMA,ADX,MACD,RSIMethanex Corporation MEOH WideScreen charts, DMA,SMA,EMA technical analysis, forecast prediction, by indicators ADX,MACD,RSI,CCI NASDAQ stock exchange
operates under Basic Industries sector & deals in Major Chemicals
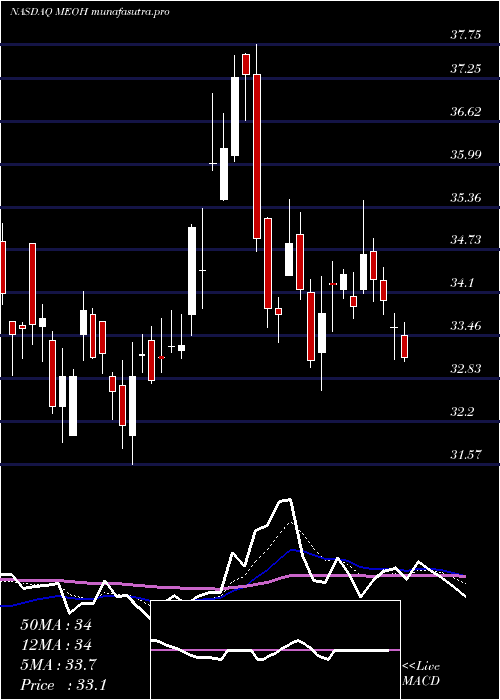
Daily price and charts and targets MethanexCorporation Strong Daily Stock price targets for MethanexCorporation MEOH are 32.23 and 34.16 | Daily Target 1 | 31.83 | | Daily Target 2 | 32.63 | | Daily Target 3 | 33.756666666667 | | Daily Target 4 | 34.56 | | Daily Target 5 | 35.69 |
Daily price and volume Methanex Corporation
| Date |
Closing |
Open |
Range |
Volume |
Thu 31 July 2025 |
33.44 (1.83%) |
33.70 |
32.95 - 34.88 |
1.5765 times |
Wed 30 July 2025 |
32.84 (-3.04%) |
33.64 |
32.65 - 33.79 |
1.2841 times |
Tue 29 July 2025 |
33.87 (-0.24%) |
34.02 |
33.56 - 34.21 |
0.9288 times |
Mon 28 July 2025 |
33.95 (-0.93%) |
34.29 |
33.53 - 34.37 |
0.7652 times |
Fri 25 July 2025 |
34.27 (2.27%) |
33.40 |
33.40 - 34.35 |
1.3938 times |
Thu 24 July 2025 |
33.51 (-3.21%) |
34.38 |
33.06 - 34.47 |
1.5619 times |
Wed 23 July 2025 |
34.62 (0.82%) |
34.79 |
34.54 - 35.33 |
1.031 times |
Tue 22 July 2025 |
34.34 (2.2%) |
33.67 |
33.62 - 34.53 |
0.5482 times |
Mon 21 July 2025 |
33.60 (-0.47%) |
33.81 |
33.51 - 34.21 |
0.4529 times |
Fri 18 July 2025 |
33.76 (-0.94%) |
34.17 |
33.58 - 34.38 |
0.4576 times |
Thu 17 July 2025 |
34.08 (2.68%) |
33.25 |
33.13 - 34.31 |
0.9993 times |
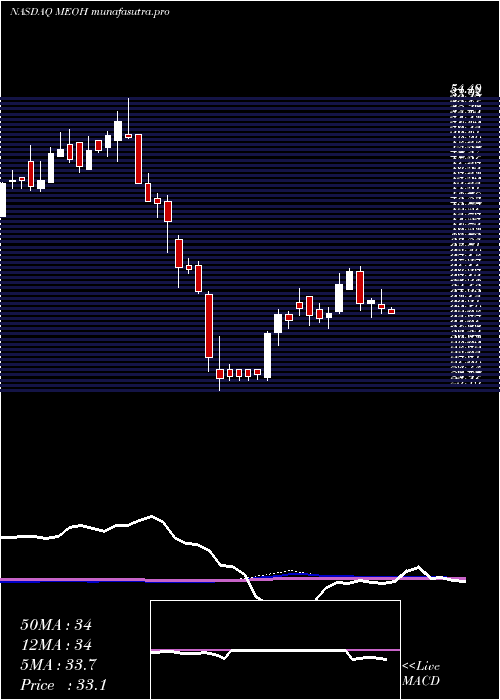
Weekly price and charts MethanexCorporation Strong weekly Stock price targets for MethanexCorporation MEOH are 31.93 and 34.16 | Weekly Target 1 | 31.43 | | Weekly Target 2 | 32.43 | | Weekly Target 3 | 33.656666666667 | | Weekly Target 4 | 34.66 | | Weekly Target 5 | 35.89 |
Weekly price and volumes for Methanex Corporation
| Date |
Closing |
Open |
Range |
Volume |
Thu 31 July 2025 |
33.44 (-2.42%) |
34.29 |
32.65 - 34.88 |
0.8952 times |
Fri 25 July 2025 |
34.27 (1.51%) |
33.81 |
33.06 - 35.33 |
0.9804 times |
Fri 18 July 2025 |
33.76 (0.54%) |
33.47 |
32.88 - 34.38 |
0.847 times |
Fri 11 July 2025 |
33.58 (-2.3%) |
34.04 |
33.11 - 35.45 |
0.9336 times |
Thu 03 July 2025 |
34.37 (0.67%) |
34.10 |
32.66 - 34.56 |
1.2079 times |
Fri 27 June 2025 |
34.14 (-8.5%) |
37.31 |
33.37 - 37.75 |
1.8187 times |
Fri 20 June 2025 |
37.31 (3.64%) |
35.47 |
35.45 - 37.61 |
0.8839 times |
Fri 13 June 2025 |
36.00 (8.63%) |
33.31 |
33.13 - 37.03 |
1.388 times |
Fri 06 June 2025 |
33.14 (1.53%) |
32.73 |
31.57 - 33.72 |
0.569 times |
Fri 30 May 2025 |
32.64 (-0.7%) |
33.48 |
32.24 - 34.11 |
0.4763 times |
Fri 23 May 2025 |
32.87 (-2.09%) |
34.82 |
31.89 - 34.82 |
0.838 times |
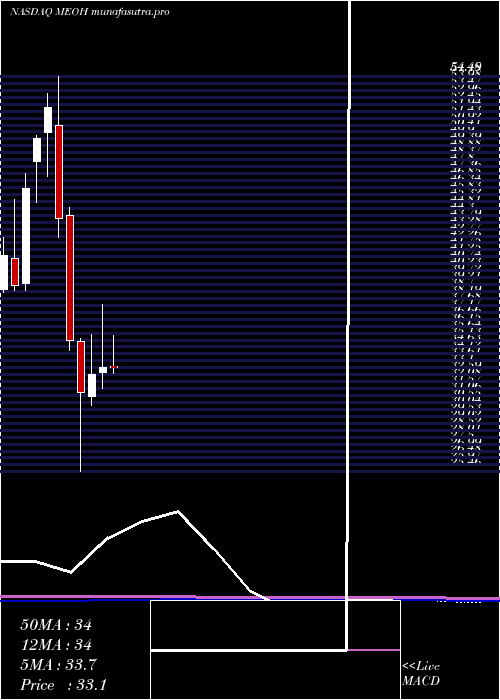
Monthly price and charts MethanexCorporation Strong monthly Stock price targets for MethanexCorporation MEOH are 33.05 and 35.85 | Monthly Target 1 | 31.05 | | Monthly Target 2 | 32.24 | | Monthly Target 3 | 33.846666666667 | | Monthly Target 4 | 35.04 | | Monthly Target 5 | 36.65 |
Monthly price and volumes Methanex Corporation
| Date |
Closing |
Open |
Range |
Volume |
Thu 31 July 2025 |
33.44 (1.03%) |
33.21 |
32.65 - 35.45 |
1.2864 times |
Mon 30 June 2025 |
33.10 (1.41%) |
32.73 |
31.57 - 37.75 |
1.4169 times |
Fri 30 May 2025 |
32.64 (4.31%) |
31.00 |
30.33 - 35.54 |
1.164 times |
Wed 30 April 2025 |
31.29 (-10.83%) |
35.00 |
25.46 - 35.28 |
1.5577 times |
Mon 31 March 2025 |
35.09 (-20.32%) |
44.28 |
34.34 - 44.83 |
0.9932 times |
Fri 28 February 2025 |
44.04 (-15.63%) |
50.90 |
42.68 - 54.49 |
0.7587 times |
Fri 31 January 2025 |
52.20 (4.53%) |
50.39 |
47.12 - 53.23 |
0.9027 times |
Tue 31 December 2024 |
49.94 (7.89%) |
48.27 |
45.26 - 50.14 |
0.5725 times |
Tue 26 November 2024 |
46.29 (18.18%) |
39.26 |
38.78 - 47.34 |
0.6582 times |
Thu 31 October 2024 |
39.17 (-5.25%) |
41.12 |
38.75 - 45.44 |
0.6896 times |
Mon 30 September 2024 |
41.34 (-11.46%) |
46.01 |
36.13 - 46.08 |
0.8955 times |
DMA SMA EMA moving averages of Methanex Corporation MEOH
DMA (daily moving average) of Methanex Corporation MEOH
| DMA period | DMA value | | 5 day DMA | 33.67 | | 12 day DMA | 33.79 | | 20 day DMA | 33.85 | | 35 day DMA | 34.26 | | 50 day DMA | 33.9 | | 100 day DMA | 33.18 | | 150 day DMA | 38.16 | | 200 day DMA | 39.4 | EMA (exponential moving average) of Methanex Corporation MEOH
| EMA period | EMA current | EMA prev | EMA prev2 | | 5 day EMA | 33.54 | 33.59 | 33.97 | | 12 day EMA | 33.73 | 33.78 | 33.95 | | 20 day EMA | 33.84 | 33.88 | 33.99 | | 35 day EMA | 33.86 | 33.89 | 33.95 | | 50 day EMA | 33.89 | 33.91 | 33.95 |
SMA (simple moving average) of Methanex Corporation MEOH
| SMA period | SMA current | SMA prev | SMA prev2 | | 5 day SMA | 33.67 | 33.69 | 34.04 | | 12 day SMA | 33.79 | 33.81 | 33.83 | | 20 day SMA | 33.85 | 33.89 | 33.94 | | 35 day SMA | 34.26 | 34.26 | 34.27 | | 50 day SMA | 33.9 | 33.9 | 33.92 | | 100 day SMA | 33.18 | 33.26 | 33.35 | | 150 day SMA | 38.16 | 38.25 | 38.34 | | 200 day SMA | 39.4 | 39.45 | 39.5 |
|
|
