MarchexInc MCHX full analysis,charts,indicators,moving averages,SMA,DMA,EMA,ADX,MACD,RSIMarchex Inc MCHX WideScreen charts, DMA,SMA,EMA technical analysis, forecast prediction, by indicators ADX,MACD,RSI,CCI NASDAQ stock exchange
operates under Miscellaneous sector & deals in Business Services
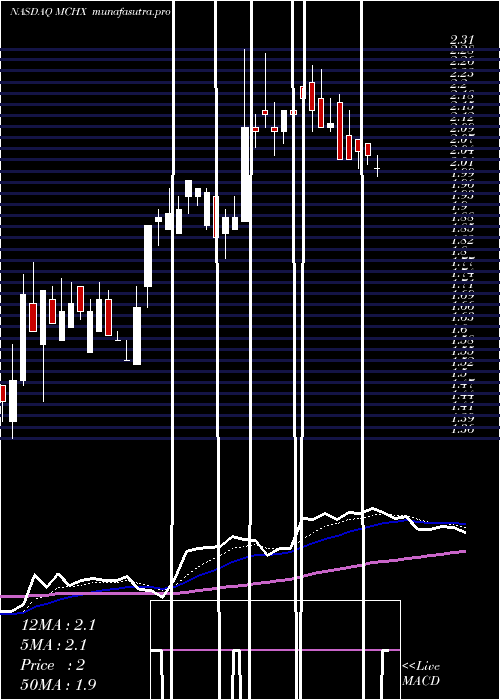
Daily price and charts and targets MarchexInc Strong Daily Stock price targets for MarchexInc MCHX are 1.92 and 1.99 | Daily Target 1 | 1.87 | | Daily Target 2 | 1.9 | | Daily Target 3 | 1.9366666666667 | | Daily Target 4 | 1.97 | | Daily Target 5 | 2.01 |
Daily price and volume Marchex Inc
| Date |
Closing |
Open |
Range |
Volume |
Thu 31 July 2025 |
1.94 (0.52%) |
1.90 |
1.90 - 1.97 |
0.3103 times |
Wed 30 July 2025 |
1.93 (0.52%) |
1.98 |
1.93 - 1.98 |
0.6479 times |
Tue 29 July 2025 |
1.92 (-3.03%) |
2.00 |
1.91 - 2.04 |
1.7247 times |
Mon 28 July 2025 |
1.98 (-2.46%) |
2.02 |
1.97 - 2.03 |
0.5567 times |
Fri 25 July 2025 |
2.03 (0%) |
2.04 |
2.00 - 2.04 |
0.4745 times |
Thu 24 July 2025 |
2.03 (-0.98%) |
2.00 |
2.00 - 2.06 |
0.3011 times |
Wed 23 July 2025 |
2.05 (1.49%) |
2.02 |
2.00 - 2.08 |
0.8304 times |
Tue 22 July 2025 |
2.02 (-3.81%) |
2.07 |
2.02 - 2.14 |
2.7924 times |
Mon 21 July 2025 |
2.10 (3.96%) |
2.01 |
2.00 - 2.10 |
1.1954 times |
Fri 18 July 2025 |
2.02 (3.59%) |
1.95 |
1.95 - 2.02 |
1.1666 times |
Thu 17 July 2025 |
1.95 (-2.5%) |
2.00 |
1.95 - 2.05 |
5.2311 times |
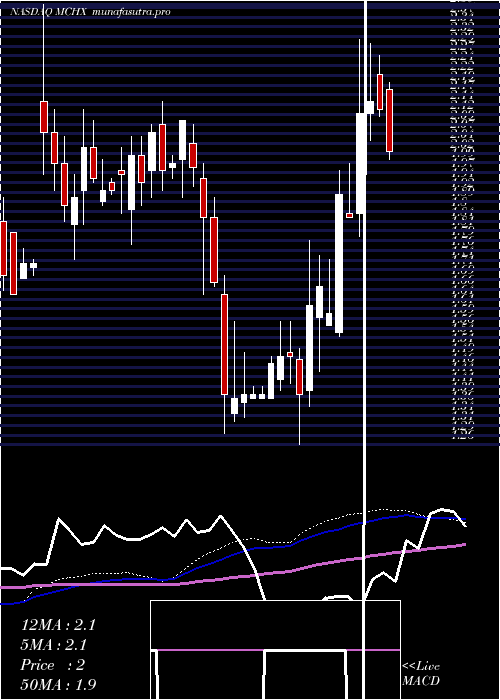
Weekly price and charts MarchexInc Strong weekly Stock price targets for MarchexInc MCHX are 1.85 and 1.99 | Weekly Target 1 | 1.82 | | Weekly Target 2 | 1.88 | | Weekly Target 3 | 1.96 | | Weekly Target 4 | 2.02 | | Weekly Target 5 | 2.1 |
Weekly price and volumes for Marchex Inc
| Date |
Closing |
Open |
Range |
Volume |
Thu 31 July 2025 |
1.94 (-4.43%) |
2.02 |
1.90 - 2.04 |
0.2163 times |
Fri 25 July 2025 |
2.03 (0.5%) |
2.01 |
2.00 - 2.14 |
0.3736 times |
Fri 18 July 2025 |
2.02 (0%) |
2.00 |
1.95 - 2.11 |
0.9495 times |
Fri 11 July 2025 |
2.02 (-5.16%) |
2.18 |
2.00 - 2.20 |
0.4942 times |
Thu 03 July 2025 |
2.13 (-0.93%) |
2.22 |
2.11 - 2.27 |
0.4059 times |
Fri 27 June 2025 |
2.15 (1.42%) |
2.12 |
2.05 - 2.30 |
0.9348 times |
Fri 20 June 2025 |
2.12 (14.59%) |
1.86 |
1.80 - 2.31 |
2.7674 times |
Fri 13 June 2025 |
1.85 (-3.14%) |
1.86 |
1.85 - 1.99 |
0.5156 times |
Fri 06 June 2025 |
1.91 (19.38%) |
1.55 |
1.54 - 1.97 |
3.0203 times |
Fri 30 May 2025 |
1.60 (-4.19%) |
1.57 |
1.57 - 1.74 |
0.3224 times |
Fri 23 May 2025 |
1.67 (3.09%) |
1.59 |
1.45 - 1.75 |
0.6911 times |
Monthly price and charts MarchexInc Strong monthly Stock price targets for MarchexInc MCHX are 1.74 and 2.11 | Monthly Target 1 | 1.67 | | Monthly Target 2 | 1.8 | | Monthly Target 3 | 2.0366666666667 | | Monthly Target 4 | 2.17 | | Monthly Target 5 | 2.41 |
Monthly price and volumes Marchex Inc
| Date |
Closing |
Open |
Range |
Volume |
Thu 31 July 2025 |
1.94 (-11.42%) |
2.23 |
1.90 - 2.27 |
0.4695 times |
Mon 30 June 2025 |
2.19 (36.88%) |
1.55 |
1.54 - 2.31 |
1.4398 times |
Fri 30 May 2025 |
1.60 (8.84%) |
1.50 |
1.26 - 1.79 |
0.6883 times |
Wed 30 April 2025 |
1.47 (-9.82%) |
1.70 |
1.29 - 1.70 |
0.5905 times |
Mon 31 March 2025 |
1.63 (-18.09%) |
2.00 |
1.63 - 2.10 |
1.2378 times |
Fri 28 February 2025 |
1.99 (-1%) |
2.01 |
1.88 - 2.15 |
1.1124 times |
Fri 31 January 2025 |
2.01 (14.86%) |
1.76 |
1.76 - 2.13 |
0.7799 times |
Tue 31 December 2024 |
1.75 (1.16%) |
2.15 |
1.74 - 2.40 |
2.1146 times |
Tue 26 November 2024 |
1.73 (-5.98%) |
1.79 |
1.65 - 1.90 |
1.0173 times |
Thu 31 October 2024 |
1.84 (-1.6%) |
1.89 |
1.60 - 1.90 |
0.5498 times |
Mon 30 September 2024 |
1.87 (-5.08%) |
2.00 |
1.65 - 2.00 |
0.5235 times |

DMA SMA EMA moving averages of Marchex Inc MCHX
DMA (daily moving average) of Marchex Inc MCHX
| DMA period | DMA value | | 5 day DMA | 1.96 | | 12 day DMA | 2 | | 20 day DMA | 2.02 | | 35 day DMA | 2.03 | | 50 day DMA | 1.94 | | 100 day DMA | 1.76 | | 150 day DMA | 1.83 | | 200 day DMA | 1.83 | EMA (exponential moving average) of Marchex Inc MCHX
| EMA period | EMA current | EMA prev | EMA prev2 | | 5 day EMA | 1.96 | 1.97 | 1.99 | | 12 day EMA | 1.99 | 2 | 2.01 | | 20 day EMA | 1.99 | 1.99 | 2 | | 35 day EMA | 1.96 | 1.96 | 1.96 | | 50 day EMA | 1.91 | 1.91 | 1.91 |
SMA (simple moving average) of Marchex Inc MCHX
| SMA period | SMA current | SMA prev | SMA prev2 | | 5 day SMA | 1.96 | 1.98 | 2 | | 12 day SMA | 2 | 2 | 2.01 | | 20 day SMA | 2.02 | 2.03 | 2.04 | | 35 day SMA | 2.03 | 2.03 | 2.03 | | 50 day SMA | 1.94 | 1.93 | 1.93 | | 100 day SMA | 1.76 | 1.76 | 1.76 | | 150 day SMA | 1.83 | 1.83 | 1.83 | | 200 day SMA | 1.83 | 1.83 | 1.83 |
|
|
