JW MAYS full analysis,charts,indicators,moving averages,SMA,DMA,EMA,ADX,MACD,RSIJ W MAYS WideScreen charts, DMA,SMA,EMA technical analysis, forecast prediction, by indicators ADX,MACD,RSI,CCI NASDAQ stock exchange
operates under Consumer Services sector & deals in Building Operators
Daily price and charts and targets JW Strong Daily Stock price targets for JW MAYS are 37.49 and 37.49 | Daily Target 1 | 37.49 | | Daily Target 2 | 37.49 | | Daily Target 3 | 37.49 | | Daily Target 4 | 37.49 | | Daily Target 5 | 37.49 |
Daily price and volume J W
| Date |
Closing |
Open |
Range |
Volume |
Fri 11 April 2025 |
37.49 (-1.34%) |
37.49 |
37.49 - 37.49 |
0.4584 times |
Thu 10 April 2025 |
38.00 (5.26%) |
38.00 |
38.00 - 38.00 |
2.292 times |
Mon 07 April 2025 |
36.10 (-6.01%) |
38.00 |
36.10 - 38.00 |
2.9796 times |
Mon 24 March 2025 |
38.41 (-1.21%) |
38.41 |
38.41 - 38.41 |
0.6876 times |
Fri 21 March 2025 |
38.88 (0.7%) |
38.99 |
38.88 - 38.99 |
0.6876 times |
Thu 20 March 2025 |
38.61 (1.13%) |
38.22 |
38.14 - 38.61 |
1.146 times |
Tue 18 March 2025 |
38.18 (1.57%) |
38.18 |
38.18 - 38.18 |
0.2292 times |
Wed 12 March 2025 |
37.59 (-3.79%) |
37.59 |
37.59 - 37.59 |
0.4584 times |
Fri 07 March 2025 |
39.07 (-0.59%) |
39.00 |
39.00 - 39.07 |
0.6876 times |
Thu 06 March 2025 |
39.30 (2.05%) |
39.30 |
39.30 - 39.30 |
0.3736 times |
Wed 05 March 2025 |
38.51 (3.24%) |
38.51 |
38.51 - 38.51 |
0.8068 times |
Weekly price and charts JW Strong weekly Stock price targets for JW MAYS are 35.85 and 37.75 | Weekly Target 1 | 35.3 | | Weekly Target 2 | 36.39 | | Weekly Target 3 | 37.196666666667 | | Weekly Target 4 | 38.29 | | Weekly Target 5 | 39.1 |
Weekly price and volumes for J W
| Date |
Closing |
Open |
Range |
Volume |
Fri 11 April 2025 |
37.49 (-2.4%) |
38.00 |
36.10 - 38.00 |
1.0597 times |
Mon 24 March 2025 |
38.41 (-1.21%) |
38.41 |
38.41 - 38.41 |
0.1272 times |
Fri 21 March 2025 |
38.88 (3.43%) |
38.18 |
38.14 - 38.99 |
0.3815 times |
Wed 12 March 2025 |
37.59 (-3.79%) |
37.59 |
37.59 - 37.59 |
0.0848 times |
Fri 07 March 2025 |
39.07 (4.75%) |
38.51 |
38.51 - 39.30 |
0.3455 times |
Wed 26 February 2025 |
37.30 (-7.33%) |
38.00 |
36.00 - 38.00 |
0.6358 times |
Tue 18 February 2025 |
40.25 (0.63%) |
40.13 |
39.99 - 40.25 |
0.1272 times |
Fri 07 February 2025 |
40.00 (-9.09%) |
42.52 |
40.00 - 42.55 |
5.9769 times |
Fri 03 January 2025 |
44.00 (1.15%) |
43.97 |
43.96 - 45.27 |
0.922 times |
Fri 20 December 2024 |
43.50 (0%) |
43.00 |
43.00 - 43.50 |
0.3395 times |
Fri 13 December 2024 |
43.50 (3.57%) |
43.95 |
42.85 - 44.00 |
3.826 times |

Monthly price and charts JW Strong monthly Stock price targets for JW MAYS are 35.85 and 37.75 | Monthly Target 1 | 35.3 | | Monthly Target 2 | 36.39 | | Monthly Target 3 | 37.196666666667 | | Monthly Target 4 | 38.29 | | Monthly Target 5 | 39.1 |
Monthly price and volumes J W
| Date |
Closing |
Open |
Range |
Volume |
Fri 11 April 2025 |
37.49 (-2.4%) |
38.00 |
36.10 - 38.00 |
0.4905 times |
Mon 24 March 2025 |
38.41 (2.98%) |
38.51 |
37.59 - 39.30 |
0.4346 times |
Wed 26 February 2025 |
37.30 (-10.12%) |
40.00 |
36.00 - 40.25 |
0.7652 times |
Tue 28 January 2025 |
41.50 (-5.7%) |
44.05 |
41.50 - 44.05 |
2.5345 times |
Tue 31 December 2024 |
44.01 (4.79%) |
43.95 |
42.85 - 45.27 |
2.1747 times |
Wed 20 November 2024 |
42.00 (-4.98%) |
43.94 |
42.00 - 44.72 |
1.5892 times |
Thu 31 October 2024 |
44.20 (-3.87%) |
44.50 |
42.00 - 46.00 |
1.7265 times |
Fri 20 September 2024 |
45.98 (6.21%) |
43.50 |
43.50 - 45.98 |
0.1766 times |
Tue 27 August 2024 |
43.29 (-0.09%) |
43.32 |
43.29 - 43.32 |
0.0806 times |
Wed 17 July 2024 |
43.33 (-5.37%) |
43.33 |
43.33 - 43.33 |
0.0277 times |
Fri 21 June 2024 |
45.79 (5.24%) |
43.25 |
43.25 - 45.79 |
0.2158 times |

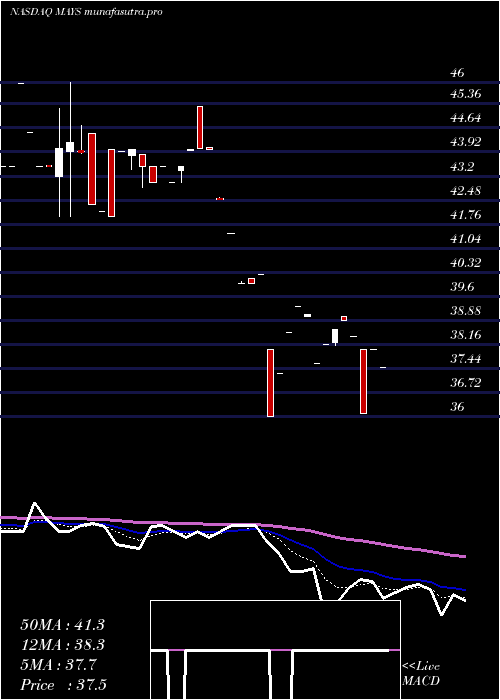
DMA SMA EMA moving averages of J W MAYS
DMA (daily moving average) of J W MAYS
| DMA period | DMA value | | 5 day DMA | 37.78 | | 12 day DMA | 38.12 | | 20 day DMA | 39.28 | | 35 day DMA | 41.04 | | 50 day DMA | 42.06 | | 100 day DMA | 43.85 | | 150 day DMA | 44.55 | | 200 day DMA | 45.18 | EMA (exponential moving average) of J W MAYS
| EMA period | EMA current | EMA prev | EMA prev2 | | 5 day EMA | 37.7 | 37.81 | 37.72 | | 12 day EMA | 38.34 | 38.5 | 38.59 | | 20 day EMA | 39.16 | 39.34 | 39.48 | | 35 day EMA | 40.41 | 40.58 | 40.73 | | 50 day EMA | 41.75 | 41.92 | 42.08 |
SMA (simple moving average) of J W MAYS
| SMA period | SMA current | SMA prev | SMA prev2 | | 5 day SMA | 37.78 | 38 | 38.04 | | 12 day SMA | 38.12 | 38 | 38.18 | | 20 day SMA | 39.28 | 39.61 | 39.88 | | 35 day SMA | 41.04 | 41.21 | 41.39 | | 50 day SMA | 42.06 | 42.18 | 42.29 | | 100 day SMA | 43.85 | 43.93 | 44 | | 150 day SMA | 44.55 | 44.6 | 44.65 | | 200 day SMA | 45.18 | 45.22 | 45.25 |
|
|
