MaxeonSolar MAXN full analysis,charts,indicators,moving averages,SMA,DMA,EMA,ADX,MACD,RSIMaxeon Solar MAXN WideScreen charts, DMA,SMA,EMA technical analysis, forecast prediction, by indicators ADX,MACD,RSI,CCI NASDAQ stock exchange
Daily price and charts and targets MaxeonSolar Strong Daily Stock price targets for MaxeonSolar MAXN are 3.33 and 3.84 | Daily Target 1 | 3.24 | | Daily Target 2 | 3.41 | | Daily Target 3 | 3.7466666666667 | | Daily Target 4 | 3.92 | | Daily Target 5 | 4.26 |
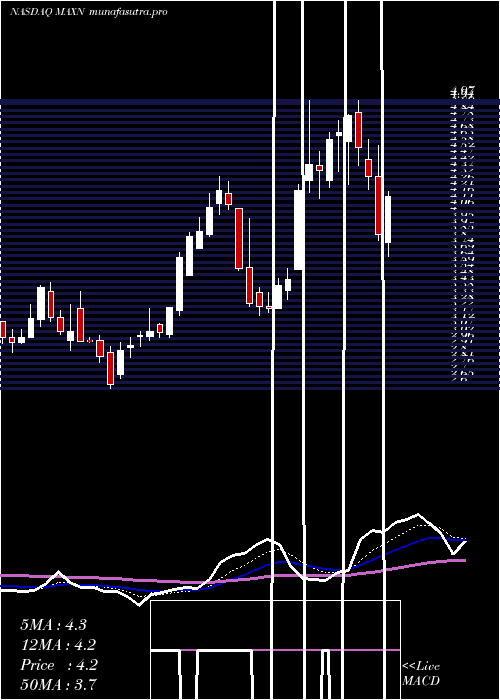
Daily price and volume Maxeon Solar
| Date |
Closing |
Open |
Range |
Volume |
Fri 11 July 2025 |
3.59 (-12.65%) |
4.08 |
3.57 - 4.08 |
2.1995 times |
Thu 10 July 2025 |
4.11 (-2.84%) |
4.20 |
4.07 - 4.30 |
0.5359 times |
Wed 09 July 2025 |
4.23 (3.42%) |
4.12 |
4.03 - 4.34 |
0.5336 times |
Tue 08 July 2025 |
4.09 (5.14%) |
3.87 |
3.85 - 4.20 |
0.8988 times |
Mon 07 July 2025 |
3.89 (1.04%) |
3.75 |
3.75 - 4.01 |
0.9025 times |
Thu 03 July 2025 |
3.85 (4.62%) |
3.53 |
3.53 - 3.88 |
0.9566 times |
Wed 02 July 2025 |
3.68 (12.54%) |
3.24 |
3.20 - 3.72 |
1.634 times |
Tue 01 July 2025 |
3.27 (6.86%) |
3.05 |
3.02 - 3.27 |
0.6746 times |
Mon 30 June 2025 |
3.06 (-0.33%) |
3.13 |
3.02 - 3.14 |
0.4527 times |
Fri 27 June 2025 |
3.07 (0.99%) |
3.03 |
3.00 - 3.26 |
1.2119 times |
Thu 26 June 2025 |
3.04 (2.7%) |
3.03 |
2.95 - 3.07 |
0.6519 times |
Weekly price and charts MaxeonSolar Strong weekly Stock price targets for MaxeonSolar MAXN are 3.2 and 3.97 | Weekly Target 1 | 3.06 | | Weekly Target 2 | 3.33 | | Weekly Target 3 | 3.8333333333333 | | Weekly Target 4 | 4.1 | | Weekly Target 5 | 4.6 |
Weekly price and volumes for Maxeon Solar
| Date |
Closing |
Open |
Range |
Volume |
Fri 11 July 2025 |
3.59 (-6.75%) |
3.75 |
3.57 - 4.34 |
1.2476 times |
Thu 03 July 2025 |
3.85 (25.41%) |
3.13 |
3.02 - 3.88 |
0.9149 times |
Fri 27 June 2025 |
3.07 (6.97%) |
2.90 |
2.60 - 3.26 |
1.2142 times |
Fri 20 June 2025 |
2.87 (-6.51%) |
3.26 |
2.82 - 3.40 |
0.7935 times |
Fri 13 June 2025 |
3.07 (1.66%) |
3.02 |
2.92 - 3.47 |
1.0154 times |
Fri 06 June 2025 |
3.02 (-0.98%) |
3.07 |
2.89 - 3.19 |
0.5302 times |
Fri 30 May 2025 |
3.05 (4.81%) |
3.02 |
2.80 - 3.16 |
0.5866 times |
Fri 23 May 2025 |
2.91 (-22.4%) |
3.75 |
2.90 - 3.90 |
1.1983 times |
Fri 16 May 2025 |
3.75 (19.43%) |
3.51 |
3.16 - 4.39 |
1.9563 times |
Fri 09 May 2025 |
3.14 (9.41%) |
2.92 |
2.72 - 3.20 |
0.543 times |
Fri 02 May 2025 |
2.87 (-19.15%) |
3.52 |
2.85 - 3.64 |
0.7175 times |

Monthly price and charts MaxeonSolar Strong monthly Stock price targets for MaxeonSolar MAXN are 3.31 and 4.63 | Monthly Target 1 | 2.33 | | Monthly Target 2 | 2.96 | | Monthly Target 3 | 3.65 | | Monthly Target 4 | 4.28 | | Monthly Target 5 | 4.97 |
Monthly price and volumes Maxeon Solar
| Date |
Closing |
Open |
Range |
Volume |
Fri 11 July 2025 |
3.59 (17.32%) |
3.05 |
3.02 - 4.34 |
0.0573 times |
Mon 30 June 2025 |
3.06 (0.33%) |
3.07 |
2.60 - 3.47 |
0.1024 times |
Fri 30 May 2025 |
3.05 (-9.5%) |
3.40 |
2.72 - 4.39 |
0.1306 times |
Wed 30 April 2025 |
3.37 (14.24%) |
3.00 |
2.49 - 3.73 |
0.1087 times |
Mon 31 March 2025 |
2.95 (-31.4%) |
4.35 |
2.68 - 4.40 |
0.157 times |
Fri 28 February 2025 |
4.30 (-30.42%) |
5.77 |
4.14 - 6.02 |
0.1675 times |
Fri 31 January 2025 |
6.18 (-18.04%) |
7.79 |
5.75 - 8.93 |
0.2163 times |
Tue 31 December 2024 |
7.54 (-1.57%) |
7.07 |
5.31 - 9.05 |
0.3047 times |
Tue 26 November 2024 |
7.66 (-17.01%) |
9.42 |
6.85 - 14.49 |
1.1431 times |
Thu 31 October 2024 |
9.23 (9130%) |
0.10 |
0.07 - 11.19 |
7.6123 times |
Mon 30 September 2024 |
0.10 (-9.09%) |
0.10 |
0.08 - 0.12 |
36.3467 times |

DMA SMA EMA moving averages of Maxeon Solar MAXN
DMA (daily moving average) of Maxeon Solar MAXN
| DMA period | DMA value | | 5 day DMA | 3.98 | | 12 day DMA | 3.57 | | 20 day DMA | 3.33 | | 35 day DMA | 3.22 | | 50 day DMA | 3.26 | | 100 day DMA | 3.38 | | 150 day DMA | 4.45 | | 200 day DMA | 4.69 | EMA (exponential moving average) of Maxeon Solar MAXN
| EMA period | EMA current | EMA prev | EMA prev2 | | 5 day EMA | 3.86 | 3.99 | 3.93 | | 12 day EMA | 3.67 | 3.68 | 3.6 | | 20 day EMA | 3.5 | 3.49 | 3.42 | | 35 day EMA | 3.36 | 3.35 | 3.31 | | 50 day EMA | 3.32 | 3.31 | 3.28 |
SMA (simple moving average) of Maxeon Solar MAXN
| SMA period | SMA current | SMA prev | SMA prev2 | | 5 day SMA | 3.98 | 4.03 | 3.95 | | 12 day SMA | 3.57 | 3.51 | 3.39 | | 20 day SMA | 3.33 | 3.32 | 3.27 | | 35 day SMA | 3.22 | 3.23 | 3.22 | | 50 day SMA | 3.26 | 3.26 | 3.24 | | 100 day SMA | 3.38 | 3.4 | 3.42 | | 150 day SMA | 4.45 | 4.48 | 4.51 | | 200 day SMA | 4.69 | 4.68 | 4.66 |
|
|
