MasimoCorporation MASI full analysis,charts,indicators,moving averages,SMA,DMA,EMA,ADX,MACD,RSIMasimo Corporation MASI WideScreen charts, DMA,SMA,EMA technical analysis, forecast prediction, by indicators ADX,MACD,RSI,CCI NASDAQ stock exchange
operates under Health Care sector & deals in Biotechnology Electromedical Electrotherapeutic Apparatus
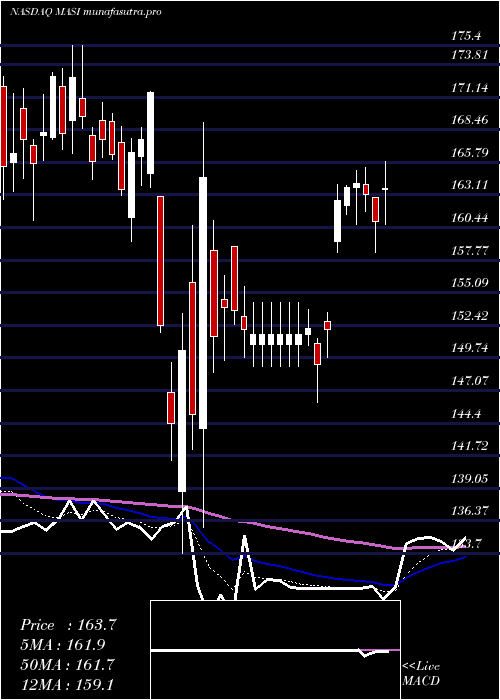
Daily price and charts and targets MasimoCorporation Strong Daily Stock price targets for MasimoCorporation MASI are 137.76 and 144.75 | Daily Target 1 | 136.45 | | Daily Target 2 | 139.07 | | Daily Target 3 | 143.44333333333 | | Daily Target 4 | 146.06 | | Daily Target 5 | 150.43 |
Daily price and volume Masimo Corporation
| Date |
Closing |
Open |
Range |
Volume |
Fri 05 December 2025 |
141.68 (-0.41%) |
142.82 |
140.83 - 147.82 |
1.0961 times |
Thu 04 December 2025 |
142.26 (3.02%) |
138.27 |
135.29 - 142.29 |
1.3609 times |
Wed 03 December 2025 |
138.09 (-2.88%) |
143.20 |
136.99 - 149.84 |
1.5895 times |
Tue 02 December 2025 |
142.19 (-1.27%) |
143.84 |
141.50 - 144.39 |
0.7159 times |
Mon 01 December 2025 |
144.02 (1.12%) |
142.24 |
141.88 - 144.45 |
0.8982 times |
Fri 28 November 2025 |
142.43 (-1.06%) |
142.79 |
142.03 - 143.80 |
0.3395 times |
Wed 26 November 2025 |
143.96 (-1.73%) |
145.73 |
143.65 - 147.15 |
0.6094 times |
Tue 25 November 2025 |
146.49 (0.6%) |
145.77 |
144.46 - 148.68 |
1.0691 times |
Mon 24 November 2025 |
145.62 (-2.43%) |
149.45 |
145.08 - 151.37 |
1.003 times |
Fri 21 November 2025 |
149.25 (4.37%) |
143.88 |
143.88 - 150.84 |
1.3186 times |
Thu 20 November 2025 |
143.00 (1.46%) |
141.58 |
141.45 - 145.91 |
0.7684 times |
Weekly price and charts MasimoCorporation Strong weekly Stock price targets for MasimoCorporation MASI are 131.21 and 145.76 | Weekly Target 1 | 127.72 | | Weekly Target 2 | 134.7 | | Weekly Target 3 | 142.27 | | Weekly Target 4 | 149.25 | | Weekly Target 5 | 156.82 |
Weekly price and volumes for Masimo Corporation
| Date |
Closing |
Open |
Range |
Volume |
Fri 05 December 2025 |
141.68 (-0.53%) |
142.24 |
135.29 - 149.84 |
1.3221 times |
Fri 28 November 2025 |
142.43 (-4.57%) |
149.45 |
142.03 - 151.37 |
0.7056 times |
Fri 21 November 2025 |
149.25 (-1.24%) |
152.26 |
139.76 - 152.26 |
1.2662 times |
Fri 14 November 2025 |
151.12 (5.56%) |
143.17 |
142.68 - 153.57 |
1.2422 times |
Fri 07 November 2025 |
143.16 (1.78%) |
143.52 |
138.55 - 157.72 |
1.596 times |
Fri 31 October 2025 |
140.65 (0%) |
141.67 |
138.68 - 142.02 |
0.2397 times |
Fri 31 October 2025 |
140.65 (-4.82%) |
147.98 |
138.68 - 148.83 |
0.8033 times |
Fri 24 October 2025 |
147.78 (0.68%) |
148.10 |
146.22 - 150.65 |
0.853 times |
Fri 17 October 2025 |
146.78 (1.48%) |
146.33 |
145.00 - 151.68 |
0.7954 times |
Fri 10 October 2025 |
144.64 (-1.8%) |
147.48 |
144.10 - 155.99 |
1.1765 times |
Fri 03 October 2025 |
147.29 (4.17%) |
142.72 |
140.51 - 149.19 |
0.9836 times |

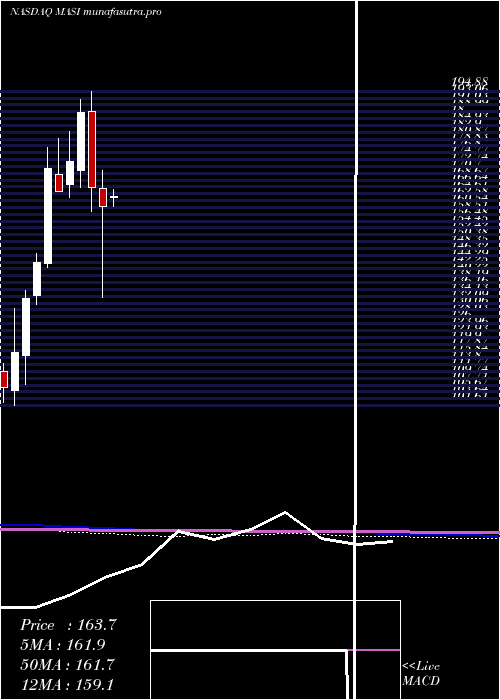
Monthly price and charts MasimoCorporation Strong monthly Stock price targets for MasimoCorporation MASI are 131.21 and 145.76 | Monthly Target 1 | 127.72 | | Monthly Target 2 | 134.7 | | Monthly Target 3 | 142.27 | | Monthly Target 4 | 149.25 | | Monthly Target 5 | 156.82 |
Monthly price and volumes Masimo Corporation
| Date |
Closing |
Open |
Range |
Volume |
Fri 05 December 2025 |
141.68 (-0.53%) |
142.24 |
135.29 - 149.84 |
0.3337 times |
Fri 28 November 2025 |
142.43 (1.27%) |
143.52 |
138.55 - 157.72 |
1.2142 times |
Fri 31 October 2025 |
140.65 (-4.68%) |
147.26 |
138.68 - 155.99 |
1.1219 times |
Tue 30 September 2025 |
147.55 (5.61%) |
137.00 |
135.34 - 149.95 |
1.0781 times |
Fri 29 August 2025 |
139.71 (-9.16%) |
153.81 |
135.83 - 164.32 |
1.3647 times |
Thu 31 July 2025 |
153.79 (-8.58%) |
168.04 |
152.73 - 172.55 |
0.9012 times |
Mon 30 June 2025 |
168.22 (3.52%) |
161.23 |
157.54 - 174.50 |
0.9376 times |
Fri 30 May 2025 |
162.50 (0.96%) |
163.54 |
142.80 - 168.62 |
1.2142 times |
Wed 30 April 2025 |
160.96 (-3.39%) |
166.27 |
133.70 - 171.56 |
0.9748 times |
Mon 31 March 2025 |
166.60 (-11.74%) |
188.99 |
159.29 - 194.88 |
0.8595 times |
Fri 28 February 2025 |
188.77 (8.35%) |
171.58 |
166.61 - 192.62 |
0.781 times |
DMA SMA EMA moving averages of Masimo Corporation MASI
DMA (daily moving average) of Masimo Corporation MASI
| DMA period | DMA value | | 5 day DMA | 141.65 | | 12 day DMA | 143.33 | | 20 day DMA | 144.93 | | 35 day DMA | 145.13 | | 50 day DMA | 145.71 | | 100 day DMA | 147.13 | | 150 day DMA | 152.09 | | 200 day DMA | 155.12 | EMA (exponential moving average) of Masimo Corporation MASI
| EMA period | EMA current | EMA prev | EMA prev2 | | 5 day EMA | 141.83 | 141.91 | 141.74 | | 12 day EMA | 143.12 | 143.38 | 143.58 | | 20 day EMA | 143.9 | 144.13 | 144.33 | | 35 day EMA | 144.62 | 144.79 | 144.94 | | 50 day EMA | 144.88 | 145.01 | 145.12 |
SMA (simple moving average) of Masimo Corporation MASI
| SMA period | SMA current | SMA prev | SMA prev2 | | 5 day SMA | 141.65 | 141.8 | 142.14 | | 12 day SMA | 143.33 | 143.51 | 143.91 | | 20 day SMA | 144.93 | 145.03 | 145.03 | | 35 day SMA | 145.13 | 145.29 | 145.47 | | 50 day SMA | 145.71 | 145.67 | 145.63 | | 100 day SMA | 147.13 | 147.3 | 147.48 | | 150 day SMA | 152.09 | 152.23 | 152.36 | | 200 day SMA | 155.12 | 155.26 | 155.44 |
|
|
