MarriottInternational MAR full analysis,charts,indicators,moving averages,SMA,DMA,EMA,ADX,MACD,RSIMarriott International MAR WideScreen charts, DMA,SMA,EMA technical analysis, forecast prediction, by indicators ADX,MACD,RSI,CCI NASDAQ stock exchange
operates under Consumer Services sector & deals in Hotels Resorts
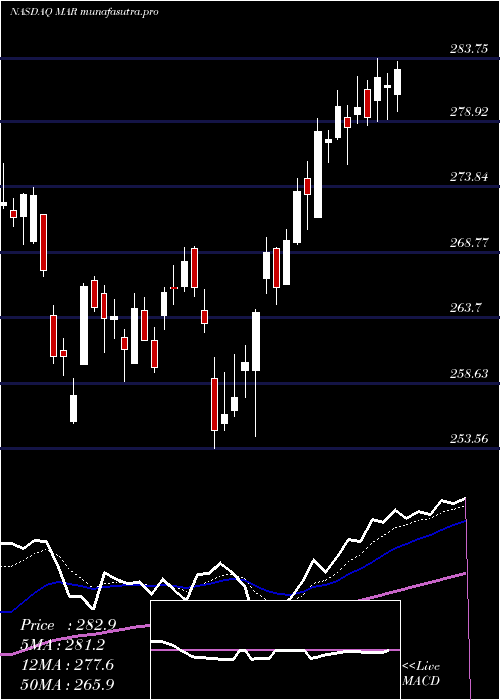
Daily price and charts and targets MarriottInternational Strong Daily Stock price targets for MarriottInternational MAR are 290.16 and 294.44 | Daily Target 1 | 289.34 | | Daily Target 2 | 290.97 | | Daily Target 3 | 293.62333333333 | | Daily Target 4 | 295.25 | | Daily Target 5 | 297.9 |
Daily price and volume Marriott International
| Date |
Closing |
Open |
Range |
Volume |
Fri 05 December 2025 |
292.59 (-1.17%) |
295.20 |
292.00 - 296.28 |
1.0855 times |
Thu 04 December 2025 |
296.05 (-3.46%) |
305.01 |
292.37 - 305.01 |
0.8446 times |
Wed 03 December 2025 |
306.65 (0.66%) |
303.52 |
303.52 - 309.43 |
0.9874 times |
Tue 02 December 2025 |
304.65 (0.4%) |
304.56 |
299.33 - 305.66 |
0.7618 times |
Mon 01 December 2025 |
303.44 (-0.44%) |
302.43 |
302.00 - 307.08 |
0.9614 times |
Fri 28 November 2025 |
304.79 (0.05%) |
303.90 |
302.95 - 305.14 |
0.3893 times |
Wed 26 November 2025 |
304.65 (0.17%) |
303.51 |
301.94 - 306.00 |
0.8394 times |
Tue 25 November 2025 |
304.12 (2.66%) |
296.67 |
296.67 - 305.01 |
0.9287 times |
Mon 24 November 2025 |
296.23 (0.13%) |
295.55 |
292.72 - 297.96 |
1.5885 times |
Fri 21 November 2025 |
295.84 (4.77%) |
284.37 |
284.27 - 298.03 |
1.6133 times |
Thu 20 November 2025 |
282.38 (-0.64%) |
285.42 |
281.72 - 289.36 |
0.8222 times |
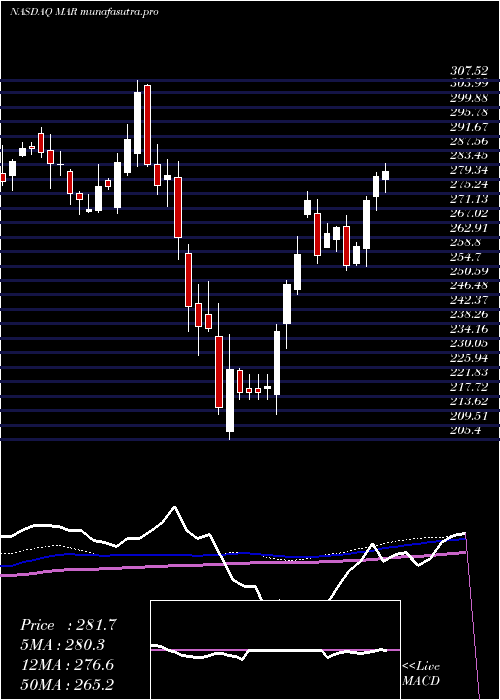
Weekly price and charts MarriottInternational Strong weekly Stock price targets for MarriottInternational MAR are 283.58 and 301.01 | Weekly Target 1 | 280.58 | | Weekly Target 2 | 286.58 | | Weekly Target 3 | 298.00666666667 | | Weekly Target 4 | 304.01 | | Weekly Target 5 | 315.44 |
Weekly price and volumes for Marriott International
| Date |
Closing |
Open |
Range |
Volume |
Fri 05 December 2025 |
292.59 (-4%) |
302.43 |
292.00 - 309.43 |
1.0443 times |
Fri 28 November 2025 |
304.79 (3.03%) |
295.55 |
292.72 - 306.00 |
0.843 times |
Fri 21 November 2025 |
295.84 (3.54%) |
286.35 |
280.99 - 298.03 |
1.1231 times |
Fri 14 November 2025 |
285.72 (-1.87%) |
292.12 |
281.19 - 294.99 |
0.9714 times |
Fri 07 November 2025 |
291.16 (11.74%) |
264.40 |
263.51 - 291.66 |
1.4611 times |
Fri 31 October 2025 |
260.58 (0%) |
261.40 |
256.76 - 261.55 |
0.2192 times |
Fri 31 October 2025 |
260.58 (-3.96%) |
272.42 |
256.76 - 274.94 |
0.932 times |
Fri 24 October 2025 |
271.32 (4.01%) |
262.30 |
259.93 - 276.80 |
1.0959 times |
Fri 17 October 2025 |
260.85 (0.25%) |
263.61 |
257.92 - 269.79 |
1.0551 times |
Fri 10 October 2025 |
260.20 (-2.75%) |
269.17 |
259.86 - 273.10 |
1.2549 times |
Fri 03 October 2025 |
267.57 (1.27%) |
265.40 |
258.07 - 268.95 |
1.1538 times |
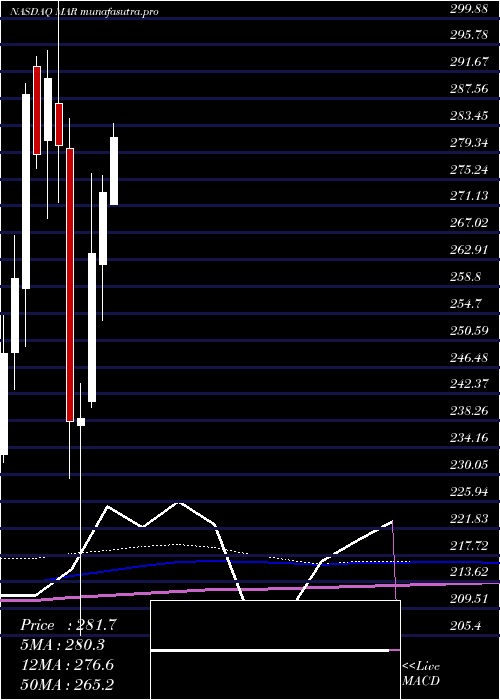
Monthly price and charts MarriottInternational Strong monthly Stock price targets for MarriottInternational MAR are 283.58 and 301.01 | Monthly Target 1 | 280.58 | | Monthly Target 2 | 286.58 | | Monthly Target 3 | 298.00666666667 | | Monthly Target 4 | 304.01 | | Monthly Target 5 | 315.44 |
Monthly price and volumes Marriott International
| Date |
Closing |
Open |
Range |
Volume |
Fri 05 December 2025 |
292.59 (-4%) |
302.43 |
292.00 - 309.43 |
0.2279 times |
Fri 28 November 2025 |
304.79 (16.97%) |
264.40 |
263.51 - 306.00 |
0.9599 times |
Fri 31 October 2025 |
260.58 (0.05%) |
258.37 |
256.76 - 276.80 |
1.1447 times |
Tue 30 September 2025 |
260.44 (-2.77%) |
264.93 |
258.89 - 271.67 |
0.9655 times |
Fri 29 August 2025 |
267.86 (1.53%) |
260.88 |
253.76 - 274.53 |
0.9027 times |
Thu 31 July 2025 |
263.83 (-3.43%) |
271.43 |
262.95 - 283.75 |
0.945 times |
Mon 30 June 2025 |
273.21 (3.56%) |
262.12 |
253.56 - 275.80 |
0.9605 times |
Fri 30 May 2025 |
263.83 (10.58%) |
241.26 |
240.36 - 276.02 |
1.0719 times |
Wed 30 April 2025 |
238.58 (0.16%) |
237.48 |
205.40 - 244.02 |
1.5608 times |
Mon 31 March 2025 |
238.20 (-15.07%) |
280.00 |
229.38 - 284.48 |
1.2612 times |
Fri 28 February 2025 |
280.45 (-3.49%) |
286.79 |
271.70 - 307.52 |
1.1291 times |
DMA SMA EMA moving averages of Marriott International MAR
DMA (daily moving average) of Marriott International MAR
| DMA period | DMA value | | 5 day DMA | 300.68 | | 12 day DMA | 297.97 | | 20 day DMA | 293.99 | | 35 day DMA | 282.91 | | 50 day DMA | 277.58 | | 100 day DMA | 272.13 | | 150 day DMA | 270.43 | | 200 day DMA | 263.57 | EMA (exponential moving average) of Marriott International MAR
| EMA period | EMA current | EMA prev | EMA prev2 | | 5 day EMA | 298.38 | 301.28 | 303.9 | | 12 day EMA | 297 | 297.8 | 298.12 | | 20 day EMA | 292.92 | 292.96 | 292.64 | | 35 day EMA | 286.25 | 285.88 | 285.28 | | 50 day EMA | 278.68 | 278.11 | 277.38 |
SMA (simple moving average) of Marriott International MAR
| SMA period | SMA current | SMA prev | SMA prev2 | | 5 day SMA | 300.68 | 303.12 | 304.84 | | 12 day SMA | 297.97 | 297.16 | 296.06 | | 20 day SMA | 293.99 | 293.42 | 292.77 | | 35 day SMA | 282.91 | 281.95 | 281.1 | | 50 day SMA | 277.58 | 276.95 | 276.27 | | 100 day SMA | 272.13 | 271.94 | 271.72 | | 150 day SMA | 270.43 | 270.1 | 269.72 | | 200 day SMA | 263.57 | 263.55 | 263.51 |
|
|
