ManhattanAssociates MANH full analysis,charts,indicators,moving averages,SMA,DMA,EMA,ADX,MACD,RSIManhattan Associates MANH WideScreen charts, DMA,SMA,EMA technical analysis, forecast prediction, by indicators ADX,MACD,RSI,CCI NASDAQ stock exchange
operates under Technology sector & deals in Computer Software Prepackaged Software
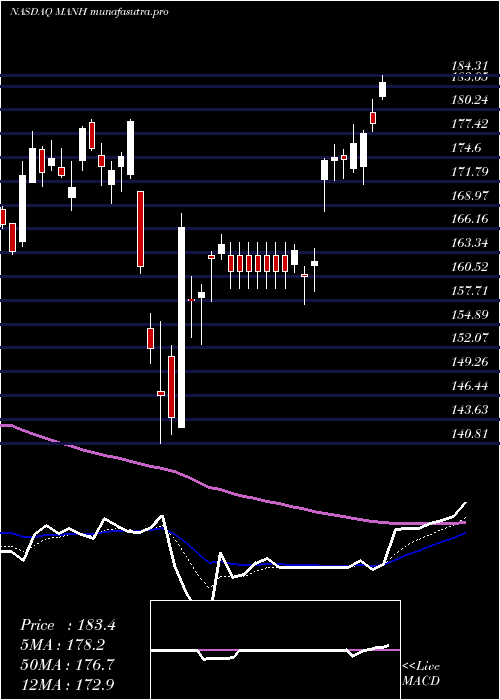
Daily price and charts and targets ManhattanAssociates Strong Daily Stock price targets for ManhattanAssociates MANH are 178.1 and 183.99 | Daily Target 1 | 173.64 | | Daily Target 2 | 176.66 | | Daily Target 3 | 179.52666666667 | | Daily Target 4 | 182.55 | | Daily Target 5 | 185.42 |
Daily price and volume Manhattan Associates
| Date |
Closing |
Open |
Range |
Volume |
Fri 05 December 2025 |
179.69 (0.61%) |
177.67 |
176.50 - 182.39 |
0.8966 times |
Thu 04 December 2025 |
178.60 (0%) |
179.47 |
178.25 - 180.77 |
0.933 times |
Wed 03 December 2025 |
178.60 (0.92%) |
177.00 |
176.53 - 179.30 |
1.0668 times |
Tue 02 December 2025 |
176.98 (0.23%) |
176.22 |
175.46 - 179.00 |
1.2495 times |
Mon 01 December 2025 |
176.58 (0.07%) |
175.00 |
173.90 - 179.70 |
1.2596 times |
Fri 28 November 2025 |
176.45 (0.23%) |
176.10 |
176.05 - 178.11 |
0.4313 times |
Wed 26 November 2025 |
176.05 (-0.34%) |
176.90 |
175.96 - 179.02 |
1.0052 times |
Tue 25 November 2025 |
176.65 (3.03%) |
171.51 |
167.00 - 176.80 |
1.0158 times |
Mon 24 November 2025 |
171.45 (0.56%) |
170.50 |
169.16 - 171.59 |
0.8751 times |
Fri 21 November 2025 |
170.49 (1.08%) |
168.16 |
167.79 - 173.82 |
1.2672 times |
Thu 20 November 2025 |
168.67 (-1.65%) |
173.83 |
167.25 - 175.33 |
1.4128 times |
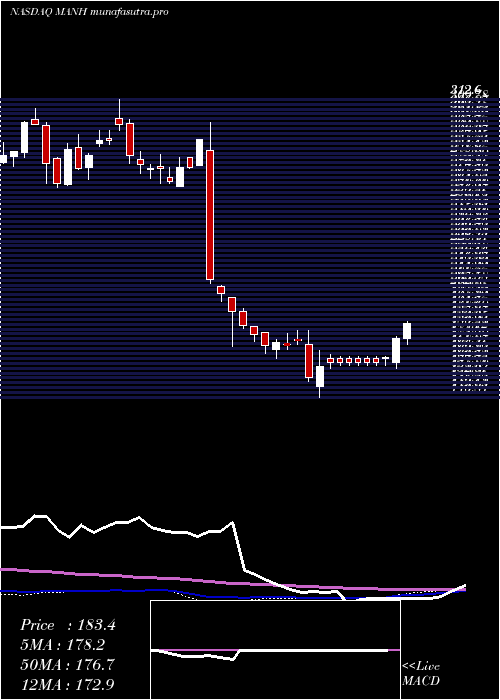
Weekly price and charts ManhattanAssociates Strong weekly Stock price targets for ManhattanAssociates MANH are 176.8 and 185.29 | Weekly Target 1 | 170.17 | | Weekly Target 2 | 174.93 | | Weekly Target 3 | 178.66 | | Weekly Target 4 | 183.42 | | Weekly Target 5 | 187.15 |
Weekly price and volumes for Manhattan Associates
| Date |
Closing |
Open |
Range |
Volume |
Fri 05 December 2025 |
179.69 (1.84%) |
175.00 |
173.90 - 182.39 |
0.9358 times |
Fri 28 November 2025 |
176.45 (3.5%) |
170.50 |
167.00 - 179.02 |
0.5761 times |
Fri 21 November 2025 |
170.49 (-4.34%) |
177.48 |
167.25 - 178.23 |
1.0711 times |
Fri 14 November 2025 |
178.23 (0.35%) |
179.38 |
173.46 - 179.93 |
0.9754 times |
Fri 07 November 2025 |
177.61 (-2.45%) |
177.68 |
172.00 - 182.64 |
0.97 times |
Fri 31 October 2025 |
182.07 (0%) |
178.01 |
175.23 - 183.42 |
0.3518 times |
Fri 31 October 2025 |
182.07 (-6.56%) |
195.04 |
175.23 - 196.31 |
1.7131 times |
Fri 24 October 2025 |
194.85 (-1.01%) |
198.70 |
186.48 - 205.11 |
1.8638 times |
Fri 17 October 2025 |
196.83 (-0.25%) |
199.10 |
192.38 - 202.90 |
0.8728 times |
Fri 10 October 2025 |
197.32 (-2.03%) |
201.50 |
195.98 - 210.36 |
0.6701 times |
Fri 03 October 2025 |
201.40 (-4.8%) |
212.70 |
196.63 - 212.94 |
0.7664 times |
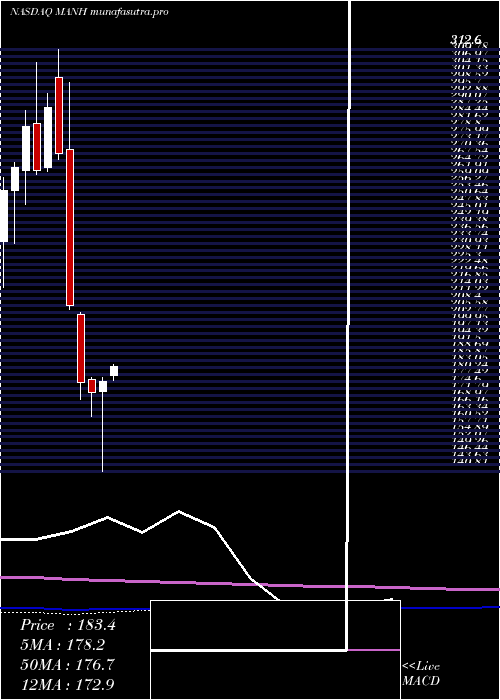
Monthly price and charts ManhattanAssociates Strong monthly Stock price targets for ManhattanAssociates MANH are 176.8 and 185.29 | Monthly Target 1 | 170.17 | | Monthly Target 2 | 174.93 | | Monthly Target 3 | 178.66 | | Monthly Target 4 | 183.42 | | Monthly Target 5 | 187.15 |
Monthly price and volumes Manhattan Associates
| Date |
Closing |
Open |
Range |
Volume |
Fri 05 December 2025 |
179.69 (1.84%) |
175.00 |
173.90 - 182.39 |
0.1829 times |
Fri 28 November 2025 |
176.45 (-3.09%) |
177.68 |
167.00 - 182.64 |
0.7021 times |
Fri 31 October 2025 |
182.07 (-11.18%) |
204.47 |
175.23 - 210.36 |
1.146 times |
Tue 30 September 2025 |
204.98 (-4.86%) |
211.40 |
202.26 - 220.31 |
0.8677 times |
Fri 29 August 2025 |
215.44 (-1.92%) |
216.83 |
203.99 - 220.72 |
0.7838 times |
Thu 31 July 2025 |
219.66 (11.24%) |
196.29 |
192.99 - 247.22 |
1.108 times |
Mon 30 June 2025 |
197.47 (4.6%) |
186.98 |
181.85 - 198.74 |
1.125 times |
Fri 30 May 2025 |
188.78 (6.42%) |
179.94 |
177.65 - 197.32 |
1.439 times |
Wed 30 April 2025 |
177.39 (2.51%) |
173.57 |
140.81 - 179.13 |
1.3779 times |
Mon 31 March 2025 |
173.04 (-2.17%) |
178.35 |
163.10 - 179.12 |
1.2676 times |
Fri 28 February 2025 |
176.88 (-15.2%) |
204.76 |
169.94 - 205.42 |
1.7755 times |
DMA SMA EMA moving averages of Manhattan Associates MANH
DMA (daily moving average) of Manhattan Associates MANH
| DMA period | DMA value | | 5 day DMA | 178.09 | | 12 day DMA | 175.14 | | 20 day DMA | 175.25 | | 35 day DMA | 180.6 | | 50 day DMA | 187.02 | | 100 day DMA | 200.64 | | 150 day DMA | 197.84 | | 200 day DMA | 190.4 | EMA (exponential moving average) of Manhattan Associates MANH
| EMA period | EMA current | EMA prev | EMA prev2 | | 5 day EMA | 178.18 | 177.43 | 176.84 | | 12 day EMA | 176.87 | 176.36 | 175.95 | | 20 day EMA | 177.74 | 177.53 | 177.42 | | 35 day EMA | 182.61 | 182.78 | 183.03 | | 50 day EMA | 188.35 | 188.7 | 189.11 |
SMA (simple moving average) of Manhattan Associates MANH
| SMA period | SMA current | SMA prev | SMA prev2 | | 5 day SMA | 178.09 | 177.44 | 176.93 | | 12 day SMA | 175.14 | 174.51 | 173.87 | | 20 day SMA | 175.25 | 175.04 | 175.11 | | 35 day SMA | 180.6 | 180.98 | 181.59 | | 50 day SMA | 187.02 | 187.62 | 188.3 | | 100 day SMA | 200.64 | 200.85 | 201.02 | | 150 day SMA | 197.84 | 197.84 | 197.83 | | 200 day SMA | 190.4 | 190.39 | 190.41 |
|
|
