LululemonAthletica LULU full analysis,charts,indicators,moving averages,SMA,DMA,EMA,ADX,MACD,RSILululemon Athletica LULU WideScreen charts, DMA,SMA,EMA technical analysis, forecast prediction, by indicators ADX,MACD,RSI,CCI NASDAQ stock exchange
operates under Consumer Non Durables sector & deals in Apparel
Daily price and charts and targets LululemonAthletica Strong Daily Stock price targets for LululemonAthletica LULU are 197.19 and 203.59 | Daily Target 1 | 196.07 | | Daily Target 2 | 198.3 | | Daily Target 3 | 202.47 | | Daily Target 4 | 204.7 | | Daily Target 5 | 208.87 |
Daily price and volume Lululemon Athletica
| Date |
Closing |
Open |
Range |
Volume |
Thu 31 July 2025 |
200.53 (-2.88%) |
203.96 |
200.24 - 206.64 |
1.4121 times |
Wed 30 July 2025 |
206.47 (-3.54%) |
214.00 |
205.89 - 214.15 |
1.3029 times |
Tue 29 July 2025 |
214.04 (-1.18%) |
216.00 |
213.88 - 219.12 |
0.8743 times |
Mon 28 July 2025 |
216.59 (-1.29%) |
220.32 |
216.33 - 220.70 |
0.8009 times |
Fri 25 July 2025 |
219.43 (0.34%) |
220.25 |
216.49 - 220.51 |
0.8921 times |
Thu 24 July 2025 |
218.69 (-2.38%) |
223.41 |
218.45 - 225.31 |
1.1775 times |
Wed 23 July 2025 |
224.03 (0.04%) |
225.00 |
222.87 - 226.24 |
0.7478 times |
Tue 22 July 2025 |
223.93 (0.32%) |
221.77 |
221.09 - 225.45 |
1.1195 times |
Mon 21 July 2025 |
223.21 (-2.51%) |
229.97 |
222.65 - 230.50 |
1.0095 times |
Fri 18 July 2025 |
228.95 (-1.87%) |
232.78 |
228.06 - 232.78 |
0.6633 times |
Thu 17 July 2025 |
233.31 (3.18%) |
227.00 |
226.93 - 233.75 |
0.9861 times |
Weekly price and charts LululemonAthletica Strong weekly Stock price targets for LululemonAthletica LULU are 190.16 and 210.62 | Weekly Target 1 | 186.7 | | Weekly Target 2 | 193.61 | | Weekly Target 3 | 207.15666666667 | | Weekly Target 4 | 214.07 | | Weekly Target 5 | 227.62 |
Weekly price and volumes for Lululemon Athletica
| Date |
Closing |
Open |
Range |
Volume |
Thu 31 July 2025 |
200.53 (-8.61%) |
220.32 |
200.24 - 220.70 |
0.7813 times |
Fri 25 July 2025 |
219.43 (-4.16%) |
229.97 |
216.49 - 230.50 |
0.8804 times |
Fri 18 July 2025 |
228.95 (-3.2%) |
235.61 |
222.06 - 236.19 |
0.9791 times |
Fri 11 July 2025 |
236.51 (-4.51%) |
245.90 |
232.09 - 247.00 |
0.7909 times |
Thu 03 July 2025 |
247.68 (5.39%) |
236.32 |
233.85 - 252.24 |
0.8328 times |
Fri 27 June 2025 |
235.02 (3.32%) |
226.73 |
219.97 - 237.20 |
1.2329 times |
Fri 20 June 2025 |
227.47 (-4.87%) |
240.82 |
227.12 - 241.30 |
0.7813 times |
Fri 13 June 2025 |
239.11 (-9.86%) |
266.54 |
238.25 - 266.95 |
1.3547 times |
Fri 06 June 2025 |
265.27 (-16.23%) |
315.13 |
262.09 - 340.25 |
1.741 times |
Fri 30 May 2025 |
316.67 (1.9%) |
315.00 |
311.32 - 322.94 |
0.6255 times |
Fri 23 May 2025 |
310.76 (-3.32%) |
316.26 |
309.79 - 330.49 |
0.466 times |

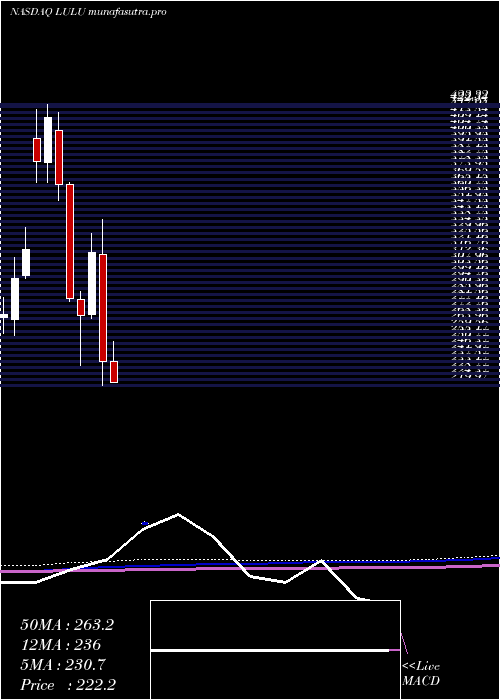
Monthly price and charts LululemonAthletica Strong monthly Stock price targets for LululemonAthletica LULU are 174.39 and 226.39 | Monthly Target 1 | 165.67 | | Monthly Target 2 | 183.1 | | Monthly Target 3 | 217.67 | | Monthly Target 4 | 235.1 | | Monthly Target 5 | 269.67 |
Monthly price and volumes Lululemon Athletica
| Date |
Closing |
Open |
Range |
Volume |
Thu 31 July 2025 |
200.53 (-15.59%) |
237.23 |
200.24 - 252.24 |
1.4557 times |
Mon 30 June 2025 |
237.58 (-24.98%) |
315.13 |
219.97 - 340.25 |
1.884 times |
Fri 30 May 2025 |
316.67 (16.95%) |
271.34 |
268.36 - 330.49 |
0.775 times |
Wed 30 April 2025 |
270.77 (-4.34%) |
282.23 |
234.84 - 287.95 |
1.2681 times |
Mon 31 March 2025 |
283.06 (-22.58%) |
365.80 |
280.83 - 367.01 |
0.9884 times |
Fri 28 February 2025 |
365.61 (-11.73%) |
404.50 |
354.05 - 417.91 |
0.6167 times |
Fri 31 January 2025 |
414.20 (8.31%) |
381.50 |
367.15 - 423.32 |
0.765 times |
Tue 31 December 2024 |
382.41 (19.94%) |
398.68 |
366.95 - 420.21 |
0.579 times |
Tue 26 November 2024 |
318.84 (7.03%) |
299.85 |
297.76 - 334.58 |
0.7439 times |
Thu 31 October 2024 |
297.90 (9.78%) |
267.67 |
256.50 - 313.09 |
0.924 times |
Mon 30 September 2024 |
271.35 (4.58%) |
258.26 |
243.37 - 283.66 |
0.8975 times |
DMA SMA EMA moving averages of Lululemon Athletica LULU
DMA (daily moving average) of Lululemon Athletica LULU
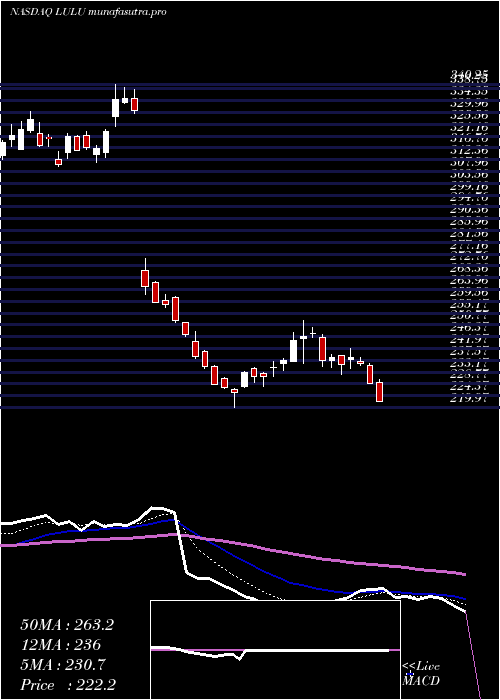
| DMA period | DMA value | | 5 day DMA | 211.41 | | 12 day DMA | 219.61 | | 20 day DMA | 226.05 | | 35 day DMA | 231.28 | | 50 day DMA | 256.27 | | 100 day DMA | 271.43 | | 150 day DMA | 309.04 | | 200 day DMA | 312.26 | EMA (exponential moving average) of Lululemon Athletica LULU
| EMA period | EMA current | EMA prev | EMA prev2 | | 5 day EMA | 209.68 | 214.26 | 218.16 | | 12 day EMA | 217.69 | 220.81 | 223.42 | | 20 day EMA | 224.78 | 227.33 | 229.53 | | 35 day EMA | 241.44 | 243.85 | 246.05 | | 50 day EMA | 256.49 | 258.77 | 260.9 |
SMA (simple moving average) of Lululemon Athletica LULU
| SMA period | SMA current | SMA prev | SMA prev2 | | 5 day SMA | 211.41 | 215.04 | 218.56 | | 12 day SMA | 219.61 | 221.41 | 223.28 | | 20 day SMA | 226.05 | 228.34 | 230.28 | | 35 day SMA | 231.28 | 232.96 | 234.64 | | 50 day SMA | 256.27 | 258.69 | 260.94 | | 100 day SMA | 271.43 | 272.9 | 274.33 | | 150 day SMA | 309.04 | 310.26 | 311.41 | | 200 day SMA | 312.26 | 312.57 | 312.85 |
|
|
