LatticeSemiconductor LSCC full analysis,charts,indicators,moving averages,SMA,DMA,EMA,ADX,MACD,RSILattice Semiconductor LSCC WideScreen charts, DMA,SMA,EMA technical analysis, forecast prediction, by indicators ADX,MACD,RSI,CCI NASDAQ stock exchange
operates under Technology sector & deals in Semiconductors
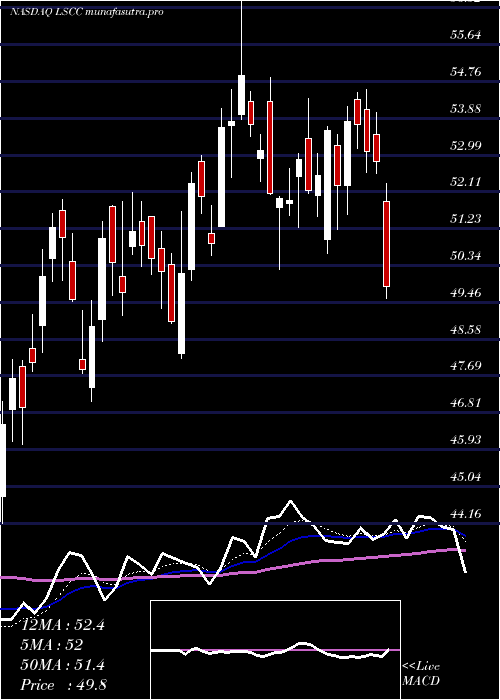
Daily price and charts and targets LatticeSemiconductor Strong Daily Stock price targets for LatticeSemiconductor LSCC are 53.04 and 54.12 | Daily Target 1 | 52.81 | | Daily Target 2 | 53.27 | | Daily Target 3 | 53.893333333333 | | Daily Target 4 | 54.35 | | Daily Target 5 | 54.97 |
Daily price and volume Lattice Semiconductor
| Date |
Closing |
Open |
Range |
Volume |
Fri 11 July 2025 |
53.72 (-2.15%) |
54.27 |
53.44 - 54.52 |
0.5018 times |
Thu 10 July 2025 |
54.90 (2.06%) |
53.96 |
53.84 - 56.75 |
1.1188 times |
Wed 09 July 2025 |
53.79 (0.26%) |
53.71 |
52.46 - 54.57 |
1.1286 times |
Tue 08 July 2025 |
53.65 (5.44%) |
51.29 |
51.29 - 54.11 |
1.0139 times |
Mon 07 July 2025 |
50.88 (-2.17%) |
51.12 |
50.58 - 51.79 |
0.996 times |
Thu 03 July 2025 |
52.01 (-0.57%) |
52.85 |
51.59 - 52.99 |
0.5409 times |
Wed 02 July 2025 |
52.31 (4.33%) |
50.26 |
49.98 - 52.58 |
1.4685 times |
Tue 01 July 2025 |
50.14 (2.35%) |
48.23 |
48.10 - 51.63 |
1.3464 times |
Mon 30 June 2025 |
48.99 (-2.39%) |
50.37 |
48.94 - 50.64 |
1.0524 times |
Fri 27 June 2025 |
50.19 (-0.61%) |
50.75 |
49.30 - 51.16 |
0.8326 times |
Thu 26 June 2025 |
50.50 (-0.61%) |
51.51 |
50.13 - 51.51 |
1.0819 times |
Weekly price and charts LatticeSemiconductor Strong weekly Stock price targets for LatticeSemiconductor LSCC are 52.15 and 58.32 | Weekly Target 1 | 47.51 | | Weekly Target 2 | 50.62 | | Weekly Target 3 | 53.683333333333 | | Weekly Target 4 | 56.79 | | Weekly Target 5 | 59.85 |
Weekly price and volumes for Lattice Semiconductor
| Date |
Closing |
Open |
Range |
Volume |
Fri 11 July 2025 |
53.72 (3.29%) |
51.12 |
50.58 - 56.75 |
0.8948 times |
Thu 03 July 2025 |
52.01 (3.63%) |
50.37 |
48.10 - 52.99 |
0.8288 times |
Fri 27 June 2025 |
50.19 (-0.46%) |
50.08 |
49.15 - 52.09 |
0.8302 times |
Fri 20 June 2025 |
50.42 (5.37%) |
47.42 |
47.09 - 51.79 |
0.7673 times |
Fri 13 June 2025 |
47.85 (-0.35%) |
48.90 |
47.76 - 51.93 |
0.8804 times |
Fri 06 June 2025 |
48.02 (6.85%) |
44.68 |
44.15 - 49.17 |
0.9353 times |
Fri 30 May 2025 |
44.94 (-3.64%) |
47.97 |
43.90 - 48.94 |
0.7098 times |
Fri 23 May 2025 |
46.64 (-11.21%) |
50.92 |
45.60 - 51.99 |
1.1301 times |
Fri 16 May 2025 |
52.53 (5.84%) |
54.05 |
51.50 - 57.23 |
1.2497 times |
Fri 09 May 2025 |
49.63 (-4.36%) |
51.47 |
45.17 - 53.39 |
1.7736 times |
Fri 02 May 2025 |
51.89 (5.81%) |
48.86 |
46.42 - 52.46 |
0.9496 times |

Monthly price and charts LatticeSemiconductor Strong monthly Stock price targets for LatticeSemiconductor LSCC are 50.91 and 59.56 | Monthly Target 1 | 44.21 | | Monthly Target 2 | 48.96 | | Monthly Target 3 | 52.856666666667 | | Monthly Target 4 | 57.61 | | Monthly Target 5 | 61.51 |
Monthly price and volumes Lattice Semiconductor
| Date |
Closing |
Open |
Range |
Volume |
Fri 11 July 2025 |
53.72 (9.66%) |
48.23 |
48.10 - 56.75 |
0.3765 times |
Mon 30 June 2025 |
48.99 (9.01%) |
44.68 |
44.15 - 52.09 |
0.891 times |
Fri 30 May 2025 |
44.94 (-8.15%) |
49.93 |
43.90 - 57.23 |
1.3025 times |
Wed 30 April 2025 |
48.93 (-6.71%) |
52.23 |
34.69 - 53.18 |
1.7768 times |
Mon 31 March 2025 |
52.45 (-15.86%) |
64.02 |
51.43 - 64.84 |
0.8895 times |
Fri 28 February 2025 |
62.34 (9.33%) |
55.11 |
52.44 - 70.55 |
1.1889 times |
Fri 31 January 2025 |
57.02 (0.65%) |
57.26 |
52.62 - 61.88 |
0.8865 times |
Tue 31 December 2024 |
56.65 (1.2%) |
59.02 |
55.95 - 64.69 |
0.6838 times |
Tue 26 November 2024 |
55.98 (10.5%) |
50.89 |
48.00 - 58.70 |
1.0446 times |
Thu 31 October 2024 |
50.66 (-4.54%) |
53.16 |
48.23 - 55.83 |
0.96 times |
Mon 30 September 2024 |
53.07 (12.06%) |
46.53 |
40.65 - 55.40 |
1.208 times |

DMA SMA EMA moving averages of Lattice Semiconductor LSCC
DMA (daily moving average) of Lattice Semiconductor LSCC
| DMA period | DMA value | | 5 day DMA | 53.39 | | 12 day DMA | 51.82 | | 20 day DMA | 51.07 | | 35 day DMA | 49.51 | | 50 day DMA | 50.01 | | 100 day DMA | 51.99 | | 150 day DMA | 54 | | 200 day DMA | 53.59 | EMA (exponential moving average) of Lattice Semiconductor LSCC
| EMA period | EMA current | EMA prev | EMA prev2 | | 5 day EMA | 53.47 | 53.34 | 52.56 | | 12 day EMA | 52.26 | 51.99 | 51.46 | | 20 day EMA | 51.39 | 51.15 | 50.76 | | 35 day EMA | 50.69 | 50.51 | 50.25 | | 50 day EMA | 50.04 | 49.89 | 49.69 |
SMA (simple moving average) of Lattice Semiconductor LSCC
| SMA period | SMA current | SMA prev | SMA prev2 | | 5 day SMA | 53.39 | 53.05 | 52.53 | | 12 day SMA | 51.82 | 51.61 | 51.18 | | 20 day SMA | 51.07 | 50.95 | 50.71 | | 35 day SMA | 49.51 | 49.42 | 49.35 | | 50 day SMA | 50.01 | 49.91 | 49.79 | | 100 day SMA | 51.99 | 52.09 | 52.18 | | 150 day SMA | 54 | 54.02 | 54.02 | | 200 day SMA | 53.59 | 53.57 | 53.52 |
|
|
