ManhattanBridge LOAN full analysis,charts,indicators,moving averages,SMA,DMA,EMA,ADX,MACD,RSIManhattan Bridge LOAN WideScreen charts, DMA,SMA,EMA technical analysis, forecast prediction, by indicators ADX,MACD,RSI,CCI NASDAQ stock exchange
operates under Consumer Services sector & deals in Real Estate Investment Trusts
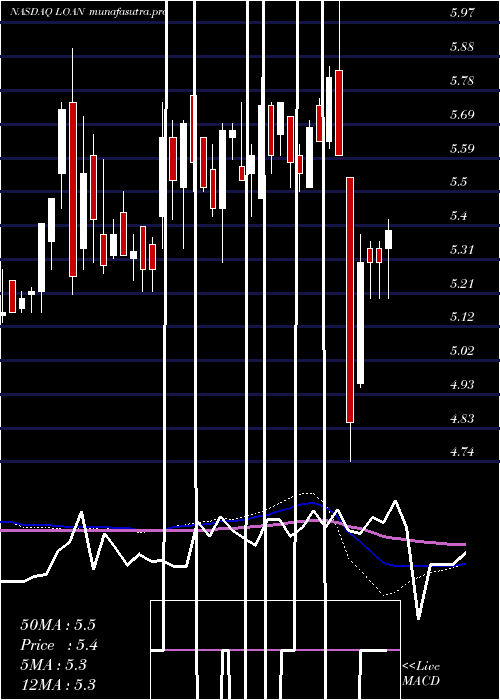
Daily price and charts and targets ManhattanBridge Strong Daily Stock price targets for ManhattanBridge LOAN are 4.63 and 4.74 | Daily Target 1 | 4.6 | | Daily Target 2 | 4.65 | | Daily Target 3 | 4.7133333333333 | | Daily Target 4 | 4.76 | | Daily Target 5 | 4.82 |
Daily price and volume Manhattan Bridge
| Date |
Closing |
Open |
Range |
Volume |
Fri 05 December 2025 |
4.69 (0%) |
4.73 |
4.67 - 4.78 |
0.4508 times |
Thu 04 December 2025 |
4.69 (-0.85%) |
4.73 |
4.67 - 4.83 |
1.223 times |
Wed 03 December 2025 |
4.73 (1.72%) |
4.65 |
4.64 - 4.74 |
0.5612 times |
Tue 02 December 2025 |
4.65 (-1.06%) |
4.72 |
4.65 - 4.72 |
0.7386 times |
Mon 01 December 2025 |
4.70 (-0.42%) |
4.72 |
4.70 - 4.74 |
1.2422 times |
Fri 28 November 2025 |
4.72 (0.64%) |
4.69 |
4.68 - 4.74 |
0.4412 times |
Wed 26 November 2025 |
4.69 (0.86%) |
4.66 |
4.65 - 4.76 |
0.9305 times |
Tue 25 November 2025 |
4.65 (3.1%) |
4.56 |
4.56 - 4.65 |
0.9832 times |
Mon 24 November 2025 |
4.51 (-0.66%) |
4.56 |
4.41 - 4.59 |
1.1271 times |
Fri 21 November 2025 |
4.54 (3.18%) |
4.41 |
4.41 - 4.63 |
2.3022 times |
Thu 20 November 2025 |
4.40 (0.46%) |
4.40 |
4.40 - 4.50 |
1.271 times |

Weekly price and charts ManhattanBridge Strong weekly Stock price targets for ManhattanBridge LOAN are 4.57 and 4.76 | Weekly Target 1 | 4.53 | | Weekly Target 2 | 4.61 | | Weekly Target 3 | 4.72 | | Weekly Target 4 | 4.8 | | Weekly Target 5 | 4.91 |
Weekly price and volumes for Manhattan Bridge
| Date |
Closing |
Open |
Range |
Volume |
Fri 05 December 2025 |
4.69 (-0.64%) |
4.72 |
4.64 - 4.83 |
0.4911 times |
Fri 28 November 2025 |
4.72 (3.96%) |
4.56 |
4.41 - 4.76 |
0.4056 times |
Fri 21 November 2025 |
4.54 (-2.37%) |
4.70 |
4.29 - 4.74 |
2.4326 times |
Fri 14 November 2025 |
4.65 (-5.49%) |
4.89 |
4.65 - 4.98 |
1.1241 times |
Fri 07 November 2025 |
4.92 (0%) |
4.92 |
4.86 - 5.00 |
0.466 times |
Fri 31 October 2025 |
4.92 (0%) |
4.91 |
4.85 - 4.96 |
0.1324 times |
Fri 31 October 2025 |
4.92 (-5.75%) |
5.15 |
4.83 - 5.22 |
1.0196 times |
Fri 24 October 2025 |
5.22 (-0.19%) |
5.22 |
5.16 - 5.28 |
0.328 times |
Fri 17 October 2025 |
5.23 (-1.32%) |
5.33 |
5.13 - 5.41 |
1.5001 times |
Fri 10 October 2025 |
5.30 (-5.69%) |
5.66 |
5.25 - 5.80 |
2.1005 times |
Fri 03 October 2025 |
5.62 (2.93%) |
5.48 |
5.41 - 5.68 |
0.6912 times |
Monthly price and charts ManhattanBridge Strong monthly Stock price targets for ManhattanBridge LOAN are 4.57 and 4.76 | Monthly Target 1 | 4.53 | | Monthly Target 2 | 4.61 | | Monthly Target 3 | 4.72 | | Monthly Target 4 | 4.8 | | Monthly Target 5 | 4.91 |
Monthly price and volumes Manhattan Bridge
| Date |
Closing |
Open |
Range |
Volume |
Fri 05 December 2025 |
4.69 (-0.64%) |
4.72 |
4.64 - 4.83 |
0.1849 times |
Fri 28 November 2025 |
4.72 (-4.07%) |
4.92 |
4.29 - 5.00 |
1.667 times |
Fri 31 October 2025 |
4.92 (-10.38%) |
5.56 |
4.83 - 5.80 |
2.0723 times |
Tue 30 September 2025 |
5.49 (3.39%) |
5.27 |
5.16 - 5.56 |
0.9561 times |
Fri 29 August 2025 |
5.31 (-2.75%) |
5.45 |
5.25 - 5.64 |
0.9622 times |
Thu 31 July 2025 |
5.46 (-0.18%) |
5.44 |
5.25 - 5.85 |
1.1348 times |
Mon 30 June 2025 |
5.47 (5.19%) |
5.20 |
5.03 - 5.49 |
0.5515 times |
Fri 30 May 2025 |
5.20 (1.56%) |
5.11 |
5.04 - 5.25 |
0.6524 times |
Wed 30 April 2025 |
5.12 (-13.37%) |
5.95 |
4.74 - 6.05 |
1.2243 times |
Mon 31 March 2025 |
5.91 (5.91%) |
5.60 |
5.50 - 6.00 |
0.5944 times |
Fri 28 February 2025 |
5.58 (-0.36%) |
5.48 |
5.48 - 5.82 |
0.4385 times |

DMA SMA EMA moving averages of Manhattan Bridge LOAN
DMA (daily moving average) of Manhattan Bridge LOAN
| DMA period | DMA value | | 5 day DMA | 4.69 | | 12 day DMA | 4.61 | | 20 day DMA | 4.67 | | 35 day DMA | 4.84 | | 50 day DMA | 5.02 | | 100 day DMA | 5.21 | | 150 day DMA | 5.23 | | 200 day DMA | 5.29 | EMA (exponential moving average) of Manhattan Bridge LOAN
| EMA period | EMA current | EMA prev | EMA prev2 | | 5 day EMA | 4.68 | 4.68 | 4.68 | | 12 day EMA | 4.67 | 4.67 | 4.67 | | 20 day EMA | 4.73 | 4.73 | 4.73 | | 35 day EMA | 4.84 | 4.85 | 4.86 | | 50 day EMA | 5.02 | 5.03 | 5.04 |
SMA (simple moving average) of Manhattan Bridge LOAN
| SMA period | SMA current | SMA prev | SMA prev2 | | 5 day SMA | 4.69 | 4.7 | 4.7 | | 12 day SMA | 4.61 | 4.59 | 4.58 | | 20 day SMA | 4.67 | 4.69 | 4.69 | | 35 day SMA | 4.84 | 4.85 | 4.87 | | 50 day SMA | 5.02 | 5.04 | 5.05 | | 100 day SMA | 5.21 | 5.22 | 5.23 | | 150 day SMA | 5.23 | 5.23 | 5.23 | | 200 day SMA | 5.29 | 5.29 | 5.3 |
|
|
