LigandPharmaceuticals LGND full analysis,charts,indicators,moving averages,SMA,DMA,EMA,ADX,MACD,RSILigand Pharmaceuticals LGND WideScreen charts, DMA,SMA,EMA technical analysis, forecast prediction, by indicators ADX,MACD,RSI,CCI NASDAQ stock exchange
operates under Health Care sector & deals in Major Pharmaceuticals
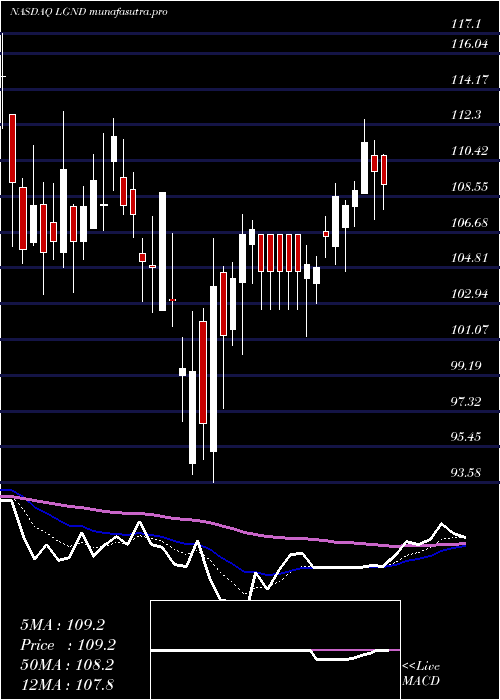
Daily price and charts and targets LigandPharmaceuticals Strong Daily Stock price targets for LigandPharmaceuticals LGND are 120.86 and 125.74 | Daily Target 1 | 119.71 | | Daily Target 2 | 122 | | Daily Target 3 | 124.58666666667 | | Daily Target 4 | 126.88 | | Daily Target 5 | 129.47 |
Daily price and volume Ligand Pharmaceuticals
| Date |
Closing |
Open |
Range |
Volume |
Tue 15 July 2025 |
124.30 (-2.06%) |
127.12 |
122.29 - 127.17 |
1.4012 times |
Mon 14 July 2025 |
126.92 (4.29%) |
120.68 |
120.68 - 127.07 |
1.0949 times |
Fri 11 July 2025 |
121.70 (-2.62%) |
124.52 |
120.74 - 124.52 |
0.8274 times |
Thu 10 July 2025 |
124.98 (2.11%) |
121.50 |
121.25 - 126.24 |
1.4253 times |
Wed 09 July 2025 |
122.40 (6.32%) |
116.60 |
116.44 - 124.62 |
1.5086 times |
Tue 08 July 2025 |
115.12 (1.2%) |
114.46 |
114.00 - 116.70 |
0.8904 times |
Mon 07 July 2025 |
113.76 (-0.72%) |
113.82 |
112.83 - 114.86 |
0.7675 times |
Thu 03 July 2025 |
114.58 (0.81%) |
113.33 |
112.41 - 114.79 |
0.4044 times |
Wed 02 July 2025 |
113.66 (0.98%) |
113.28 |
111.72 - 114.68 |
0.8274 times |
Tue 01 July 2025 |
112.56 (-0.99%) |
112.42 |
112.11 - 115.53 |
0.853 times |
Mon 30 June 2025 |
113.68 (-0.41%) |
115.38 |
113.27 - 115.38 |
0.8655 times |
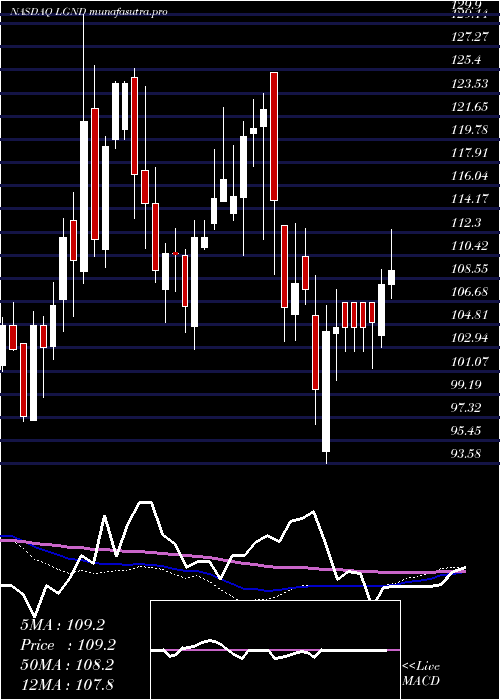
Weekly price and charts LigandPharmaceuticals Strong weekly Stock price targets for LigandPharmaceuticals LGND are 122.49 and 128.98 | Weekly Target 1 | 117.56 | | Weekly Target 2 | 120.93 | | Weekly Target 3 | 124.05 | | Weekly Target 4 | 127.42 | | Weekly Target 5 | 130.54 |
Weekly price and volumes for Ligand Pharmaceuticals
| Date |
Closing |
Open |
Range |
Volume |
Tue 15 July 2025 |
124.30 (2.14%) |
120.68 |
120.68 - 127.17 |
0.5756 times |
Fri 11 July 2025 |
121.70 (6.21%) |
113.82 |
112.83 - 126.24 |
1.2496 times |
Thu 03 July 2025 |
114.58 (0.38%) |
115.38 |
111.72 - 115.53 |
0.6803 times |
Fri 27 June 2025 |
114.15 (0.07%) |
113.80 |
110.00 - 118.58 |
1.5885 times |
Fri 20 June 2025 |
114.07 (1.4%) |
113.68 |
111.88 - 116.16 |
0.9457 times |
Fri 13 June 2025 |
112.50 (6.14%) |
106.49 |
103.43 - 116.40 |
1.2138 times |
Fri 06 June 2025 |
105.99 (3.72%) |
102.51 |
100.67 - 106.70 |
0.8709 times |
Fri 30 May 2025 |
102.19 (0.58%) |
103.11 |
98.89 - 104.01 |
0.9427 times |
Fri 23 May 2025 |
101.60 (-2.81%) |
104.00 |
99.29 - 105.42 |
0.8474 times |
Fri 16 May 2025 |
104.54 (0.06%) |
107.54 |
102.69 - 109.20 |
1.0854 times |
Fri 09 May 2025 |
104.48 (-4.49%) |
109.20 |
99.24 - 109.20 |
1.2215 times |
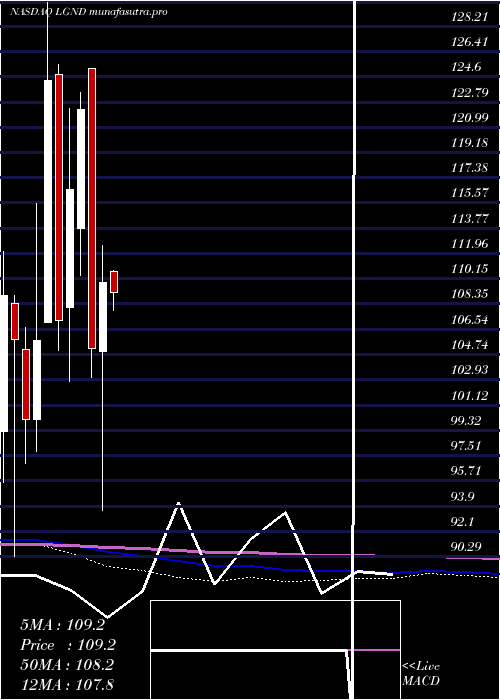
Monthly price and charts LigandPharmaceuticals Strong monthly Stock price targets for LigandPharmaceuticals LGND are 118.01 and 133.46 | Monthly Target 1 | 105.61 | | Monthly Target 2 | 114.96 | | Monthly Target 3 | 121.06333333333 | | Monthly Target 4 | 130.41 | | Monthly Target 5 | 136.51 |
Monthly price and volumes Ligand Pharmaceuticals
| Date |
Closing |
Open |
Range |
Volume |
Tue 15 July 2025 |
124.30 (9.34%) |
112.42 |
111.72 - 127.17 |
0.5818 times |
Mon 30 June 2025 |
113.68 (11.24%) |
102.51 |
100.67 - 118.58 |
1.2158 times |
Fri 30 May 2025 |
102.19 (-6.98%) |
110.67 |
98.89 - 111.42 |
1.1055 times |
Wed 30 April 2025 |
109.86 (4.49%) |
104.95 |
93.58 - 112.55 |
0.9568 times |
Mon 31 March 2025 |
105.14 (-13.98%) |
125.17 |
103.06 - 125.17 |
1.1577 times |
Fri 28 February 2025 |
122.23 (4.87%) |
113.76 |
110.42 - 123.51 |
0.8315 times |
Fri 31 January 2025 |
116.55 (8.77%) |
108.12 |
102.79 - 122.34 |
0.8711 times |
Tue 31 December 2024 |
107.15 (-13.82%) |
124.78 |
105.00 - 125.50 |
1.0352 times |
Tue 26 November 2024 |
124.33 (17.63%) |
107.05 |
107.05 - 129.90 |
1.3117 times |
Thu 31 October 2024 |
105.70 (5.6%) |
100.10 |
97.78 - 115.53 |
0.9328 times |
Mon 30 September 2024 |
100.09 (-5.4%) |
105.08 |
96.96 - 106.65 |
0.8847 times |
DMA SMA EMA moving averages of Ligand Pharmaceuticals LGND
DMA (daily moving average) of Ligand Pharmaceuticals LGND
| DMA period | DMA value | | 5 day DMA | 124.06 | | 12 day DMA | 118.15 | | 20 day DMA | 116.81 | | 35 day DMA | 111.85 | | 50 day DMA | 109.87 | | 100 day DMA | 109.29 | | 150 day DMA | 110.92 | | 200 day DMA | 110.54 | EMA (exponential moving average) of Ligand Pharmaceuticals LGND
| EMA period | EMA current | EMA prev | EMA prev2 | | 5 day EMA | 123.13 | 122.55 | 120.36 | | 12 day EMA | 119.75 | 118.92 | 117.47 | | 20 day EMA | 117.25 | 116.51 | 115.41 | | 35 day EMA | 114.08 | 113.48 | 112.69 | | 50 day EMA | 111.24 | 110.71 | 110.05 |
SMA (simple moving average) of Ligand Pharmaceuticals LGND
| SMA period | SMA current | SMA prev | SMA prev2 | | 5 day SMA | 124.06 | 122.22 | 119.59 | | 12 day SMA | 118.15 | 117.43 | 116.5 | | 20 day SMA | 116.81 | 116.32 | 115.74 | | 35 day SMA | 111.85 | 111.22 | 110.6 | | 50 day SMA | 109.87 | 109.58 | 109.27 | | 100 day SMA | 109.29 | 109.27 | 109.2 | | 150 day SMA | 110.92 | 110.92 | 110.9 | | 200 day SMA | 110.54 | 110.44 | 110.33 |
|
|
