LakelandIndustries LAKE full analysis,charts,indicators,moving averages,SMA,DMA,EMA,ADX,MACD,RSILakeland Industries LAKE WideScreen charts, DMA,SMA,EMA technical analysis, forecast prediction, by indicators ADX,MACD,RSI,CCI NASDAQ stock exchange
operates under Health Care sector & deals in Industrial Specialties
Daily price and charts and targets LakelandIndustries Strong Daily Stock price targets for LakelandIndustries LAKE are 13.51 and 13.99 | Daily Target 1 | 13.41 | | Daily Target 2 | 13.6 | | Daily Target 3 | 13.893333333333 | | Daily Target 4 | 14.08 | | Daily Target 5 | 14.37 |
Daily price and volume Lakeland Industries
| Date |
Closing |
Open |
Range |
Volume |
Mon 14 July 2025 |
13.78 (-3.7%) |
14.19 |
13.71 - 14.19 |
1.0335 times |
Fri 11 July 2025 |
14.31 (0.21%) |
14.26 |
14.07 - 14.45 |
0.4413 times |
Thu 10 July 2025 |
14.28 (-0.49%) |
14.35 |
14.11 - 14.44 |
0.8713 times |
Wed 09 July 2025 |
14.35 (-1.44%) |
14.57 |
14.21 - 14.82 |
0.9121 times |
Tue 08 July 2025 |
14.56 (1.82%) |
14.28 |
14.07 - 14.80 |
1.1259 times |
Mon 07 July 2025 |
14.30 (3.03%) |
13.67 |
13.67 - 14.34 |
1.3106 times |
Thu 03 July 2025 |
13.88 (1.68%) |
13.84 |
13.50 - 13.89 |
0.7052 times |
Wed 02 July 2025 |
13.65 (0.22%) |
13.59 |
13.38 - 13.85 |
0.83 times |
Tue 01 July 2025 |
13.62 (0.07%) |
13.54 |
13.40 - 14.20 |
1.1082 times |
Mon 30 June 2025 |
13.61 (3.26%) |
13.27 |
13.00 - 13.69 |
1.662 times |
Fri 27 June 2025 |
13.18 (1%) |
13.15 |
12.98 - 13.38 |
7.4004 times |
Weekly price and charts LakelandIndustries Strong weekly Stock price targets for LakelandIndustries LAKE are 13.51 and 13.99 | Weekly Target 1 | 13.41 | | Weekly Target 2 | 13.6 | | Weekly Target 3 | 13.893333333333 | | Weekly Target 4 | 14.08 | | Weekly Target 5 | 14.37 |
Weekly price and volumes for Lakeland Industries
| Date |
Closing |
Open |
Range |
Volume |
Mon 14 July 2025 |
13.78 (-3.7%) |
14.19 |
13.71 - 14.19 |
0.2159 times |
Fri 11 July 2025 |
14.31 (3.1%) |
13.67 |
13.67 - 14.82 |
0.9739 times |
Thu 03 July 2025 |
13.88 (5.31%) |
13.27 |
13.00 - 14.20 |
0.8995 times |
Fri 27 June 2025 |
13.18 (-0.9%) |
13.25 |
12.98 - 14.25 |
2.5648 times |
Fri 20 June 2025 |
13.30 (-4.45%) |
13.69 |
12.76 - 13.89 |
1.0684 times |
Fri 13 June 2025 |
13.92 (-22.75%) |
18.15 |
13.92 - 19.77 |
2.6438 times |
Fri 06 June 2025 |
18.02 (-5.46%) |
19.01 |
17.80 - 19.31 |
0.4981 times |
Fri 30 May 2025 |
19.06 (4.5%) |
18.48 |
18.48 - 19.74 |
0.2295 times |
Fri 23 May 2025 |
18.24 (-4.4%) |
18.68 |
18.09 - 20.50 |
0.4733 times |
Fri 16 May 2025 |
19.08 (11.84%) |
17.84 |
17.67 - 19.96 |
0.4328 times |
Fri 09 May 2025 |
17.06 (1.31%) |
16.68 |
15.85 - 17.31 |
0.247 times |

Monthly price and charts LakelandIndustries Strong monthly Stock price targets for LakelandIndustries LAKE are 13.58 and 15.02 | Monthly Target 1 | 12.55 | | Monthly Target 2 | 13.17 | | Monthly Target 3 | 13.993333333333 | | Monthly Target 4 | 14.61 | | Monthly Target 5 | 15.43 |
Monthly price and volumes Lakeland Industries
| Date |
Closing |
Open |
Range |
Volume |
Mon 14 July 2025 |
13.78 (1.25%) |
13.54 |
13.38 - 14.82 |
0.8411 times |
Mon 30 June 2025 |
13.61 (-28.59%) |
19.01 |
12.76 - 19.77 |
3.4387 times |
Fri 30 May 2025 |
19.06 (16.72%) |
16.42 |
15.85 - 20.50 |
0.731 times |
Wed 30 April 2025 |
16.33 (-19.6%) |
20.20 |
14.58 - 20.83 |
0.8884 times |
Mon 31 March 2025 |
20.31 (-13.94%) |
23.33 |
18.61 - 23.87 |
1.0301 times |
Fri 28 February 2025 |
23.60 (1.77%) |
22.55 |
22.24 - 25.53 |
0.6351 times |
Fri 31 January 2025 |
23.19 (-9.24%) |
25.98 |
22.20 - 27.28 |
1.1615 times |
Tue 31 December 2024 |
25.55 (15.61%) |
22.68 |
21.33 - 25.74 |
0.4776 times |
Tue 26 November 2024 |
22.10 (18.88%) |
18.39 |
18.39 - 22.21 |
0.3203 times |
Thu 31 October 2024 |
18.59 (-7.51%) |
20.00 |
18.42 - 21.87 |
0.4763 times |
Mon 30 September 2024 |
20.10 (-16.6%) |
23.97 |
18.40 - 24.35 |
0.5604 times |

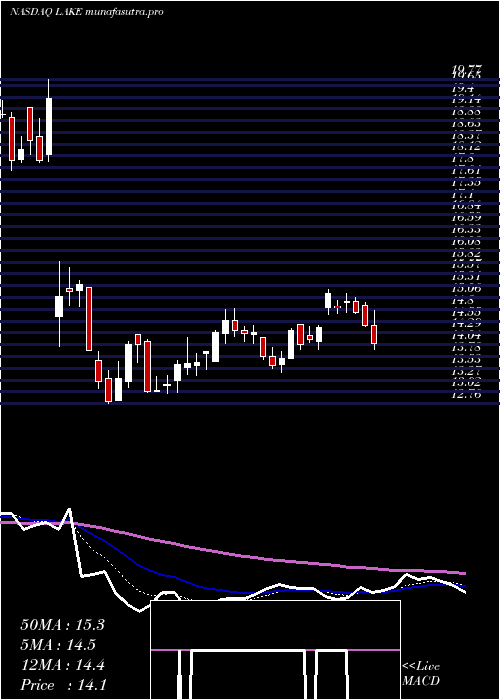
DMA SMA EMA moving averages of Lakeland Industries LAKE
DMA (daily moving average) of Lakeland Industries LAKE
| DMA period | DMA value | | 5 day DMA | 14.26 | | 12 day DMA | 13.88 | | 20 day DMA | 13.81 | | 35 day DMA | 15.71 | | 50 day DMA | 16.27 | | 100 day DMA | 17.76 | | 150 day DMA | 19.9 | | 200 day DMA | 20 | EMA (exponential moving average) of Lakeland Industries LAKE
| EMA period | EMA current | EMA prev | EMA prev2 | | 5 day EMA | 14.09 | 14.24 | 14.21 | | 12 day EMA | 14.12 | 14.18 | 14.16 | | 20 day EMA | 14.43 | 14.5 | 14.52 | | 35 day EMA | 15.09 | 15.17 | 15.22 | | 50 day EMA | 16.08 | 16.17 | 16.25 |
SMA (simple moving average) of Lakeland Industries LAKE
| SMA period | SMA current | SMA prev | SMA prev2 | | 5 day SMA | 14.26 | 14.36 | 14.27 | | 12 day SMA | 13.88 | 13.82 | 13.8 | | 20 day SMA | 13.81 | 13.88 | 13.92 | | 35 day SMA | 15.71 | 15.88 | 16.03 | | 50 day SMA | 16.27 | 16.33 | 16.37 | | 100 day SMA | 17.76 | 17.87 | 17.96 | | 150 day SMA | 19.9 | 19.96 | 20.01 | | 200 day SMA | 20 | 20.03 | 20.06 |
|
|
