InnovativeSolutions ISSC full analysis,charts,indicators,moving averages,SMA,DMA,EMA,ADX,MACD,RSIInnovative Solutions ISSC WideScreen charts, DMA,SMA,EMA technical analysis, forecast prediction, by indicators ADX,MACD,RSI,CCI NASDAQ stock exchange
operates under Technology sector & deals in EDP Services
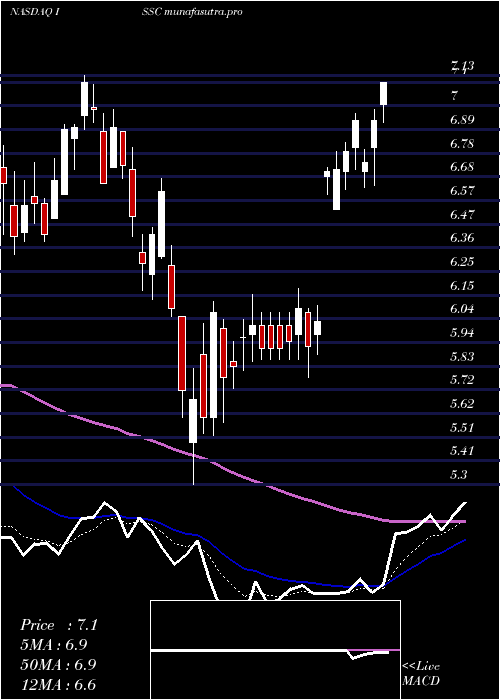
Daily price and charts and targets InnovativeSolutions Strong Daily Stock price targets for InnovativeSolutions ISSC are 13.13 and 14.59 | Daily Target 1 | 12.03 | | Daily Target 2 | 12.77 | | Daily Target 3 | 13.486666666667 | | Daily Target 4 | 14.23 | | Daily Target 5 | 14.95 |
Daily price and volume Innovative Solutions
| Date |
Closing |
Open |
Range |
Volume |
Fri 11 July 2025 |
13.52 (0%) |
13.51 |
12.74 - 14.20 |
2.4763 times |
Thu 10 July 2025 |
13.52 (-4.72%) |
14.20 |
13.47 - 14.22 |
0.6515 times |
Wed 09 July 2025 |
14.19 (2.98%) |
13.94 |
13.84 - 14.33 |
0.5968 times |
Tue 08 July 2025 |
13.78 (-0.58%) |
13.81 |
13.50 - 14.19 |
0.6253 times |
Mon 07 July 2025 |
13.86 (-1%) |
13.97 |
13.33 - 13.99 |
1.1349 times |
Thu 03 July 2025 |
14.00 (-3.71%) |
14.72 |
13.77 - 14.72 |
0.7185 times |
Wed 02 July 2025 |
14.54 (5.13%) |
13.83 |
13.52 - 14.58 |
0.988 times |
Tue 01 July 2025 |
13.83 (-0.36%) |
13.67 |
13.45 - 14.05 |
0.7395 times |
Mon 30 June 2025 |
13.88 (-0.5%) |
14.09 |
13.47 - 14.21 |
1.0474 times |
Fri 27 June 2025 |
13.95 (5.52%) |
13.33 |
13.18 - 14.37 |
1.0217 times |
Thu 26 June 2025 |
13.22 (1.07%) |
13.18 |
13.11 - 13.41 |
0.5556 times |
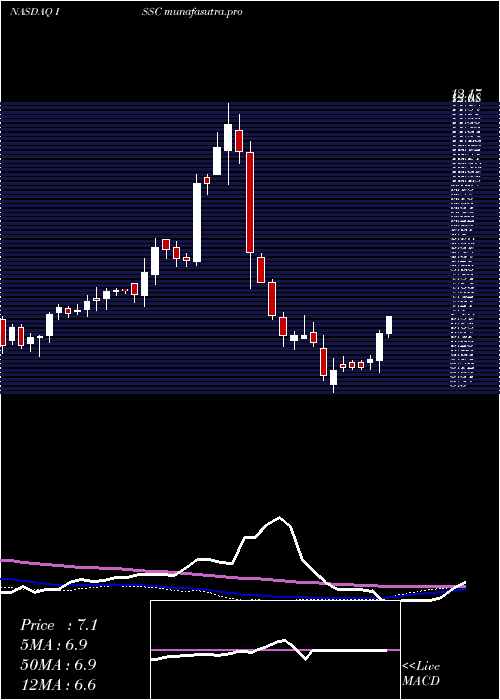
Weekly price and charts InnovativeSolutions Strong weekly Stock price targets for InnovativeSolutions ISSC are 12.34 and 13.93 | Weekly Target 1 | 11.94 | | Weekly Target 2 | 12.73 | | Weekly Target 3 | 13.53 | | Weekly Target 4 | 14.32 | | Weekly Target 5 | 15.12 |
Weekly price and volumes for Innovative Solutions
| Date |
Closing |
Open |
Range |
Volume |
Fri 11 July 2025 |
13.52 (-3.43%) |
13.97 |
12.74 - 14.33 |
1.8815 times |
Thu 03 July 2025 |
14.00 (0.36%) |
14.09 |
13.45 - 14.72 |
1.1984 times |
Fri 27 June 2025 |
13.95 (13.05%) |
12.60 |
12.26 - 14.37 |
1.3132 times |
Fri 20 June 2025 |
12.34 (-2.37%) |
12.99 |
12.07 - 13.20 |
0.4868 times |
Fri 13 June 2025 |
12.64 (7.48%) |
11.77 |
11.33 - 12.90 |
0.839 times |
Fri 06 June 2025 |
11.76 (5.09%) |
11.25 |
11.06 - 11.97 |
0.8749 times |
Fri 30 May 2025 |
11.19 (7.08%) |
10.50 |
9.94 - 11.33 |
0.6798 times |
Fri 23 May 2025 |
10.45 (8.74%) |
9.90 |
9.75 - 10.85 |
0.8999 times |
Fri 16 May 2025 |
9.61 (39.88%) |
7.02 |
6.94 - 10.50 |
1.6904 times |
Fri 09 May 2025 |
6.87 (-3.24%) |
6.99 |
6.65 - 7.06 |
0.136 times |
Fri 02 May 2025 |
7.10 (5.81%) |
6.70 |
6.62 - 7.10 |
0.1774 times |
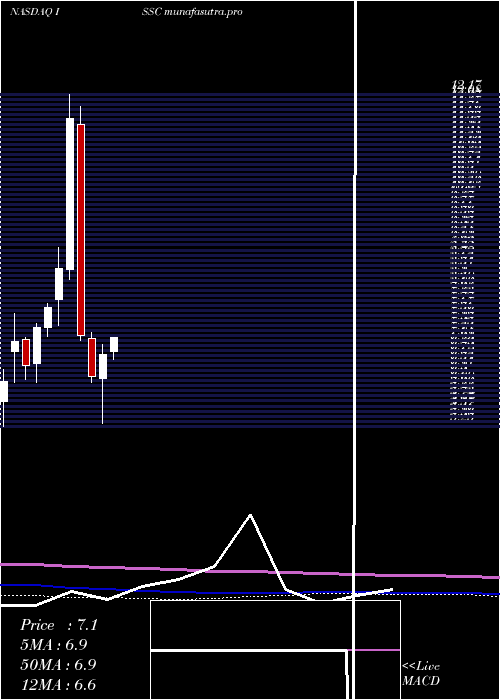
Monthly price and charts InnovativeSolutions Strong monthly Stock price targets for InnovativeSolutions ISSC are 12.14 and 14.12 | Monthly Target 1 | 11.68 | | Monthly Target 2 | 12.6 | | Monthly Target 3 | 13.66 | | Monthly Target 4 | 14.58 | | Monthly Target 5 | 15.64 |
Monthly price and volumes Innovative Solutions
| Date |
Closing |
Open |
Range |
Volume |
Fri 11 July 2025 |
13.52 (-2.59%) |
13.67 |
12.74 - 14.72 |
1.0715 times |
Mon 30 June 2025 |
13.88 (24.04%) |
11.25 |
11.06 - 14.37 |
1.5255 times |
Fri 30 May 2025 |
11.19 (66.02%) |
6.81 |
6.64 - 11.33 |
1.3682 times |
Wed 30 April 2025 |
6.74 (7.15%) |
6.24 |
5.30 - 6.96 |
0.446 times |
Mon 31 March 2025 |
6.29 (-11.9%) |
7.08 |
6.17 - 7.20 |
0.6651 times |
Fri 28 February 2025 |
7.14 (-38.82%) |
11.54 |
7.03 - 11.92 |
1.7429 times |
Fri 31 January 2025 |
11.67 (36.65%) |
8.52 |
8.30 - 12.17 |
1.7124 times |
Tue 31 December 2024 |
8.54 (10.62%) |
7.90 |
7.36 - 8.97 |
0.7809 times |
Tue 26 November 2024 |
7.72 (5.75%) |
7.30 |
7.12 - 7.80 |
0.3697 times |
Thu 31 October 2024 |
7.30 (11.96%) |
6.55 |
6.15 - 7.39 |
0.3177 times |
Mon 30 September 2024 |
6.52 (-7.12%) |
7.05 |
6.22 - 7.10 |
0.1803 times |
DMA SMA EMA moving averages of Innovative Solutions ISSC
DMA (daily moving average) of Innovative Solutions ISSC
| DMA period | DMA value | | 5 day DMA | 13.77 | | 12 day DMA | 13.78 | | 20 day DMA | 13.28 | | 35 day DMA | 12.31 | | 50 day DMA | 10.9 | | 100 day DMA | 8.77 | | 150 day DMA | 8.97 | | 200 day DMA | 8.49 | EMA (exponential moving average) of Innovative Solutions ISSC
| EMA period | EMA current | EMA prev | EMA prev2 | | 5 day EMA | 13.73 | 13.83 | 13.98 | | 12 day EMA | 13.59 | 13.6 | 13.61 | | 20 day EMA | 13.13 | 13.09 | 13.05 | | 35 day EMA | 12 | 11.91 | 11.82 | | 50 day EMA | 10.82 | 10.71 | 10.6 |
SMA (simple moving average) of Innovative Solutions ISSC
| SMA period | SMA current | SMA prev | SMA prev2 | | 5 day SMA | 13.77 | 13.87 | 14.07 | | 12 day SMA | 13.78 | 13.77 | 13.69 | | 20 day SMA | 13.28 | 13.19 | 13.1 | | 35 day SMA | 12.31 | 12.24 | 12.13 | | 50 day SMA | 10.9 | 10.76 | 10.63 | | 100 day SMA | 8.77 | 8.74 | 8.72 | | 150 day SMA | 8.97 | 8.93 | 8.89 | | 200 day SMA | 8.49 | 8.46 | 8.43 |
|
|
