IdealPower IPWR full analysis,charts,indicators,moving averages,SMA,DMA,EMA,ADX,MACD,RSIIdeal Power IPWR WideScreen charts, DMA,SMA,EMA technical analysis, forecast prediction, by indicators ADX,MACD,RSI,CCI NASDAQ stock exchange
operates under Energy sector & deals in Industrial Machinery Components
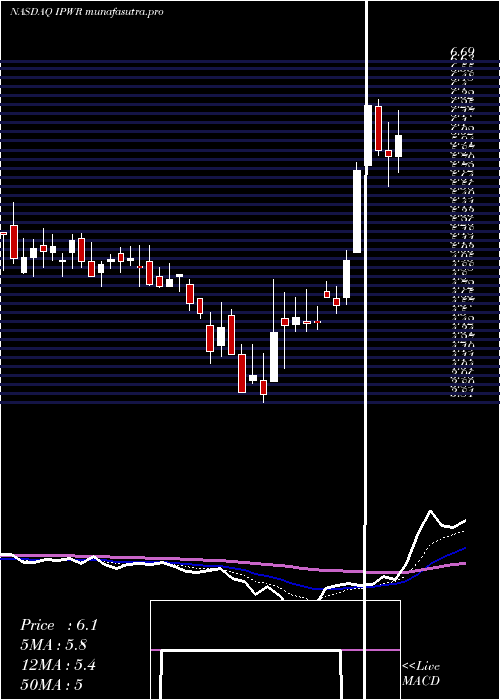
Daily price and charts and targets IdealPower Strong Daily Stock price targets for IdealPower IPWR are 3.76 and 4.19 | Daily Target 1 | 3.43 | | Daily Target 2 | 3.66 | | Daily Target 3 | 3.8566666666667 | | Daily Target 4 | 4.09 | | Daily Target 5 | 4.29 |
Daily price and volume Ideal Power
| Date |
Closing |
Open |
Range |
Volume |
Fri 05 December 2025 |
3.90 (7.44%) |
3.65 |
3.62 - 4.05 |
1.097 times |
Thu 04 December 2025 |
3.63 (8.68%) |
3.33 |
3.32 - 4.01 |
1.1019 times |
Wed 03 December 2025 |
3.34 (-1.76%) |
3.45 |
3.06 - 3.50 |
4.4295 times |
Tue 02 December 2025 |
3.40 (-3.13%) |
3.58 |
3.32 - 3.83 |
0.8947 times |
Mon 01 December 2025 |
3.51 (-6.4%) |
3.83 |
3.51 - 3.95 |
0.6948 times |
Fri 28 November 2025 |
3.75 (-4.58%) |
3.95 |
3.75 - 4.03 |
0.4949 times |
Wed 26 November 2025 |
3.93 (1.03%) |
3.90 |
3.74 - 4.06 |
0.3145 times |
Tue 25 November 2025 |
3.89 (4.57%) |
3.80 |
3.74 - 3.90 |
0.1195 times |
Mon 24 November 2025 |
3.72 (3.33%) |
3.63 |
3.63 - 3.79 |
0.4376 times |
Fri 21 November 2025 |
3.60 (-2.7%) |
3.72 |
3.53 - 3.73 |
0.4157 times |
Thu 20 November 2025 |
3.70 (-1.07%) |
3.76 |
3.70 - 3.86 |
0.5436 times |
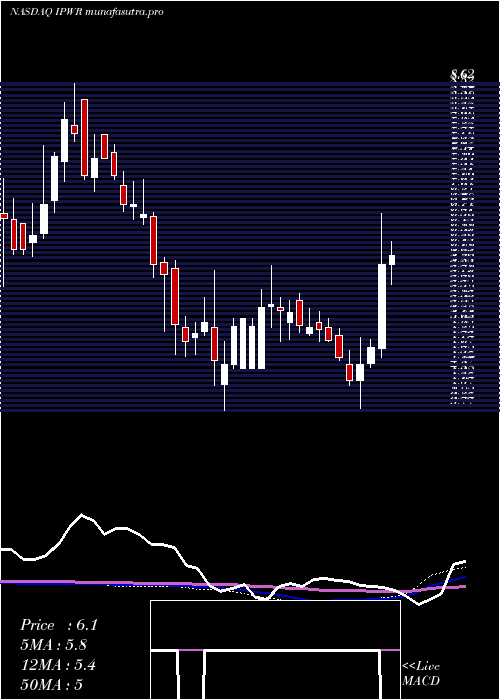
Weekly price and charts IdealPower Strong weekly Stock price targets for IdealPower IPWR are 3.48 and 4.47 | Weekly Target 1 | 2.68 | | Weekly Target 2 | 3.29 | | Weekly Target 3 | 3.67 | | Weekly Target 4 | 4.28 | | Weekly Target 5 | 4.66 |
Weekly price and volumes for Ideal Power
| Date |
Closing |
Open |
Range |
Volume |
Fri 05 December 2025 |
3.90 (4%) |
3.83 |
3.06 - 4.05 |
2.2662 times |
Fri 28 November 2025 |
3.75 (4.17%) |
3.63 |
3.63 - 4.06 |
0.3768 times |
Fri 21 November 2025 |
3.60 (-11.55%) |
4.02 |
3.53 - 4.11 |
0.797 times |
Fri 14 November 2025 |
4.07 (-19.25%) |
4.99 |
3.63 - 5.13 |
2.0524 times |
Fri 07 November 2025 |
5.04 (-10.16%) |
5.12 |
4.67 - 5.26 |
0.5809 times |
Fri 31 October 2025 |
5.61 (0%) |
5.53 |
5.36 - 5.62 |
0.0652 times |
Fri 31 October 2025 |
5.61 (-1.06%) |
5.70 |
5.25 - 5.81 |
0.5096 times |
Fri 24 October 2025 |
5.67 (-1.22%) |
5.70 |
5.43 - 5.95 |
0.6281 times |
Fri 17 October 2025 |
5.74 (16.67%) |
4.86 |
4.62 - 5.75 |
1.6071 times |
Fri 10 October 2025 |
4.92 (-8.04%) |
5.43 |
4.82 - 5.58 |
1.1166 times |
Fri 03 October 2025 |
5.35 (5.94%) |
5.06 |
4.74 - 5.57 |
0.7207 times |
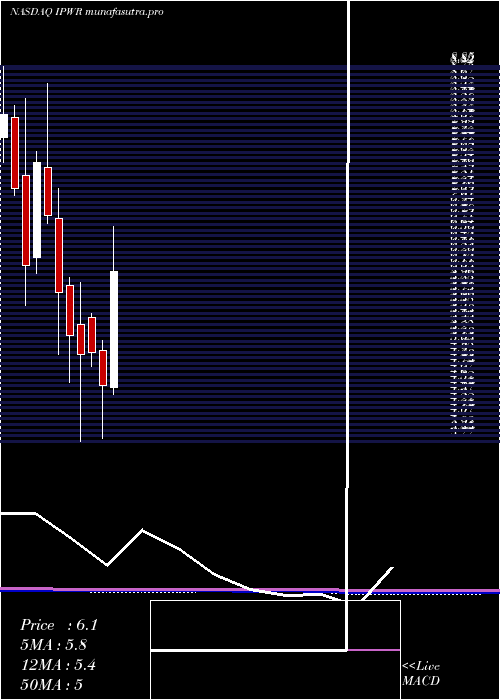
Monthly price and charts IdealPower Strong monthly Stock price targets for IdealPower IPWR are 3.48 and 4.47 | Monthly Target 1 | 2.68 | | Monthly Target 2 | 3.29 | | Monthly Target 3 | 3.67 | | Monthly Target 4 | 4.28 | | Monthly Target 5 | 4.66 |
Monthly price and volumes Ideal Power
| Date |
Closing |
Open |
Range |
Volume |
Fri 05 December 2025 |
3.90 (4%) |
3.83 |
3.06 - 4.05 |
0.6874 times |
Fri 28 November 2025 |
3.75 (-33.16%) |
5.12 |
3.53 - 5.26 |
1.1548 times |
Fri 31 October 2025 |
5.61 (11.75%) |
4.96 |
4.62 - 5.95 |
1.3045 times |
Tue 30 September 2025 |
5.02 (-4.2%) |
5.11 |
4.74 - 6.90 |
1.2749 times |
Fri 29 August 2025 |
5.24 (9.17%) |
4.70 |
3.83 - 5.78 |
2.2782 times |
Thu 31 July 2025 |
4.80 (5.96%) |
4.50 |
4.41 - 6.69 |
0.9494 times |
Mon 30 June 2025 |
4.53 (-9.04%) |
5.00 |
3.81 - 5.14 |
1.2171 times |
Fri 30 May 2025 |
4.98 (0.61%) |
5.45 |
4.79 - 5.50 |
0.3208 times |
Wed 30 April 2025 |
4.95 (-4.81%) |
5.36 |
3.77 - 5.92 |
0.4324 times |
Mon 31 March 2025 |
5.20 (-10.19%) |
5.88 |
4.57 - 5.99 |
0.3806 times |
Fri 28 February 2025 |
5.79 (-15.23%) |
6.79 |
4.95 - 7.20 |
0.5874 times |
DMA SMA EMA moving averages of Ideal Power IPWR
DMA (daily moving average) of Ideal Power IPWR
| DMA period | DMA value | | 5 day DMA | 3.56 | | 12 day DMA | 3.68 | | 20 day DMA | 3.96 | | 35 day DMA | 4.6 | | 50 day DMA | 4.75 | | 100 day DMA | 4.95 | | 150 day DMA | 4.95 | | 200 day DMA | 4.97 | EMA (exponential moving average) of Ideal Power IPWR
| EMA period | EMA current | EMA prev | EMA prev2 | | 5 day EMA | 3.67 | 3.56 | 3.52 | | 12 day EMA | 3.76 | 3.74 | 3.76 | | 20 day EMA | 3.99 | 4 | 4.04 | | 35 day EMA | 4.32 | 4.34 | 4.38 | | 50 day EMA | 4.71 | 4.74 | 4.79 |
SMA (simple moving average) of Ideal Power IPWR
| SMA period | SMA current | SMA prev | SMA prev2 | | 5 day SMA | 3.56 | 3.53 | 3.59 | | 12 day SMA | 3.68 | 3.66 | 3.67 | | 20 day SMA | 3.96 | 4.01 | 4.08 | | 35 day SMA | 4.6 | 4.63 | 4.68 | | 50 day SMA | 4.75 | 4.78 | 4.81 | | 100 day SMA | 4.95 | 4.97 | 4.99 | | 150 day SMA | 4.95 | 4.96 | 4.97 | | 200 day SMA | 4.97 | 4.98 | 4.99 |
|
|
