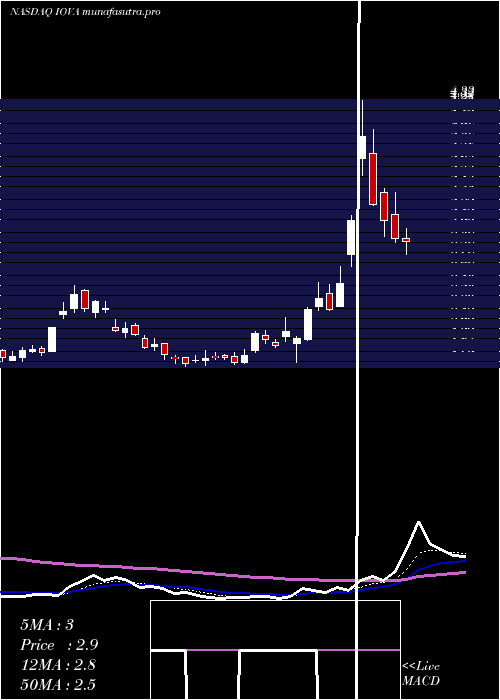
IovanceBiotherapeutics IOVA full analysis,charts,indicators,moving averages,SMA,DMA,EMA,ADX,MACD,RSIIovance Biotherapeutics IOVA WideScreen charts, DMA,SMA,EMA technical analysis, forecast prediction, by indicators ADX,MACD,RSI,CCI NASDAQ stock exchange
operates under Health Care sector & deals in Biotechnology Biological Products No Diagnostic Substances
Daily price and charts and targets IovanceBiotherapeutics Strong Daily Stock price targets for IovanceBiotherapeutics IOVA are 1.82 and 1.9 | Daily Target 1 | 1.8 | | Daily Target 2 | 1.84 | | Daily Target 3 | 1.8833333333333 | | Daily Target 4 | 1.92 | | Daily Target 5 | 1.96 |
Daily price and volume Iovance Biotherapeutics
| Date |
Closing |
Open |
Range |
Volume |
Fri 11 July 2025 |
1.87 (-3.11%) |
1.90 |
1.85 - 1.93 |
0.6379 times |
Thu 10 July 2025 |
1.93 (-3.02%) |
1.97 |
1.89 - 2.02 |
1.2759 times |
Wed 09 July 2025 |
1.99 (12.43%) |
1.82 |
1.80 - 2.01 |
1.7687 times |
Tue 08 July 2025 |
1.77 (4.12%) |
1.70 |
1.69 - 1.83 |
0.9949 times |
Mon 07 July 2025 |
1.70 (-2.86%) |
1.76 |
1.68 - 1.80 |
1.0399 times |
Thu 03 July 2025 |
1.75 (0%) |
1.77 |
1.73 - 1.78 |
0.4362 times |
Wed 02 July 2025 |
1.75 (0.57%) |
1.76 |
1.73 - 1.80 |
0.6353 times |
Tue 01 July 2025 |
1.74 (1.16%) |
1.72 |
1.67 - 1.82 |
0.8757 times |
Mon 30 June 2025 |
1.72 (1.78%) |
1.72 |
1.70 - 1.77 |
0.6858 times |
Fri 27 June 2025 |
1.69 (-2.87%) |
1.75 |
1.66 - 1.75 |
1.6495 times |
Thu 26 June 2025 |
1.74 (-2.25%) |
1.75 |
1.69 - 1.77 |
1.1572 times |
Weekly price and charts IovanceBiotherapeutics Strong weekly Stock price targets for IovanceBiotherapeutics IOVA are 1.78 and 2.12 | Weekly Target 1 | 1.52 | | Weekly Target 2 | 1.69 | | Weekly Target 3 | 1.8566666666667 | | Weekly Target 4 | 2.03 | | Weekly Target 5 | 2.2 |
Weekly price and volumes for Iovance Biotherapeutics
| Date |
Closing |
Open |
Range |
Volume |
Fri 11 July 2025 |
1.87 (6.86%) |
1.76 |
1.68 - 2.02 |
0.8792 times |
Thu 03 July 2025 |
1.75 (3.55%) |
1.72 |
1.67 - 1.82 |
0.4049 times |
Fri 27 June 2025 |
1.69 (-14.65%) |
1.94 |
1.66 - 1.97 |
0.8637 times |
Fri 20 June 2025 |
1.98 (-11.61%) |
2.05 |
1.95 - 2.13 |
0.3974 times |
Fri 13 June 2025 |
2.24 (9.27%) |
2.18 |
2.14 - 2.47 |
1.1406 times |
Fri 06 June 2025 |
2.05 (17.14%) |
1.72 |
1.71 - 2.05 |
0.7542 times |
Fri 30 May 2025 |
1.75 (-1.69%) |
1.81 |
1.70 - 1.87 |
0.6609 times |
Fri 23 May 2025 |
1.78 (7.23%) |
1.64 |
1.64 - 1.97 |
0.8262 times |
Fri 16 May 2025 |
1.66 (-5.14%) |
1.85 |
1.64 - 2.04 |
1.6329 times |
Fri 09 May 2025 |
1.75 (-50%) |
3.51 |
1.65 - 3.73 |
2.4401 times |
Fri 02 May 2025 |
3.50 (-0.28%) |
3.54 |
3.32 - 3.66 |
0.5855 times |

Monthly price and charts IovanceBiotherapeutics Strong monthly Stock price targets for IovanceBiotherapeutics IOVA are 1.77 and 2.12 | Monthly Target 1 | 1.5 | | Monthly Target 2 | 1.69 | | Monthly Target 3 | 1.8533333333333 | | Monthly Target 4 | 2.04 | | Monthly Target 5 | 2.2 |
Monthly price and volumes Iovance Biotherapeutics
| Date |
Closing |
Open |
Range |
Volume |
Fri 11 July 2025 |
1.87 (8.72%) |
1.72 |
1.67 - 2.02 |
0.4358 times |
Mon 30 June 2025 |
1.72 (-1.71%) |
1.72 |
1.66 - 2.47 |
1.2058 times |
Fri 30 May 2025 |
1.75 (-51.25%) |
3.60 |
1.64 - 3.73 |
2.1661 times |
Wed 30 April 2025 |
3.59 (7.81%) |
3.32 |
2.70 - 3.66 |
1.0495 times |
Mon 31 March 2025 |
3.33 (-21.46%) |
4.27 |
3.19 - 4.57 |
0.9928 times |
Fri 28 February 2025 |
4.24 (-27.52%) |
5.59 |
3.62 - 6.16 |
1.0267 times |
Fri 31 January 2025 |
5.85 (-20.95%) |
7.54 |
5.57 - 8.15 |
1.0686 times |
Tue 31 December 2024 |
7.40 (-18.86%) |
9.13 |
7.05 - 9.30 |
0.5249 times |
Tue 26 November 2024 |
9.12 (-12.64%) |
10.62 |
7.98 - 12.51 |
0.9615 times |
Thu 31 October 2024 |
10.44 (11.18%) |
9.30 |
8.97 - 11.33 |
0.5684 times |
Mon 30 September 2024 |
9.39 (-19.47%) |
11.50 |
8.80 - 11.80 |
0.5898 times |

DMA SMA EMA moving averages of Iovance Biotherapeutics IOVA
DMA (daily moving average) of Iovance Biotherapeutics IOVA
| DMA period | DMA value | | 5 day DMA | 1.85 | | 12 day DMA | 1.79 | | 20 day DMA | 1.9 | | 35 day DMA | 1.89 | | 50 day DMA | 2.11 | | 100 day DMA | 2.94 | | 150 day DMA | 4.22 | | 200 day DMA | 5.64 | EMA (exponential moving average) of Iovance Biotherapeutics IOVA
| EMA period | EMA current | EMA prev | EMA prev2 | | 5 day EMA | 1.86 | 1.86 | 1.83 | | 12 day EMA | 1.85 | 1.85 | 1.83 | | 20 day EMA | 1.88 | 1.88 | 1.88 | | 35 day EMA | 2.03 | 2.04 | 2.05 | | 50 day EMA | 2.19 | 2.2 | 2.21 |
SMA (simple moving average) of Iovance Biotherapeutics IOVA
| SMA period | SMA current | SMA prev | SMA prev2 | | 5 day SMA | 1.85 | 1.83 | 1.79 | | 12 day SMA | 1.79 | 1.79 | 1.78 | | 20 day SMA | 1.9 | 1.93 | 1.94 | | 35 day SMA | 1.89 | 1.89 | 1.88 | | 50 day SMA | 2.11 | 2.14 | 2.17 | | 100 day SMA | 2.94 | 2.98 | 3.01 | | 150 day SMA | 4.22 | 4.27 | 4.32 | | 200 day SMA | 5.64 | 5.68 | 5.72 |
|
|
