IntrusionInc INTZ full analysis,charts,indicators,moving averages,SMA,DMA,EMA,ADX,MACD,RSIIntrusion Inc INTZ WideScreen charts, DMA,SMA,EMA technical analysis, forecast prediction, by indicators ADX,MACD,RSI,CCI NASDAQ stock exchange
Daily price and charts and targets IntrusionInc Strong Daily Stock price targets for IntrusionInc INTZ are 2.08 and 2.21 | Daily Target 1 | 1.98 | | Daily Target 2 | 2.05 | | Daily Target 3 | 2.1133333333333 | | Daily Target 4 | 2.18 | | Daily Target 5 | 2.24 |
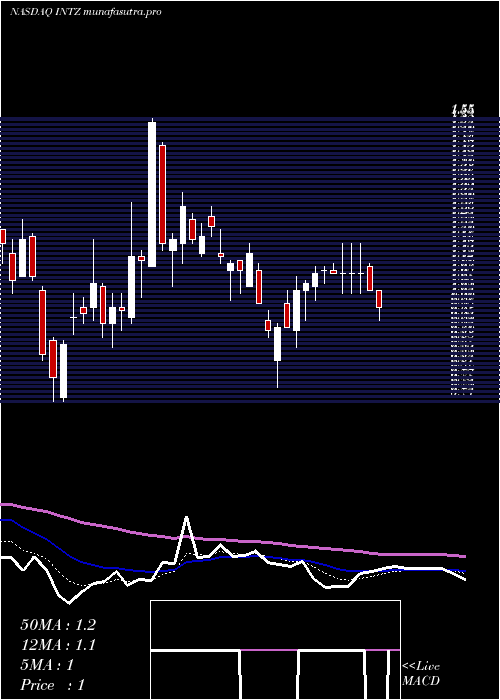
Daily price and volume Intrusion Inc
| Date |
Closing |
Open |
Range |
Volume |
Mon 14 July 2025 |
2.11 (0.96%) |
2.09 |
2.05 - 2.18 |
0.5126 times |
Fri 11 July 2025 |
2.09 (-9.52%) |
2.30 |
2.08 - 2.30 |
1.3099 times |
Thu 10 July 2025 |
2.31 (0.43%) |
2.31 |
2.26 - 2.38 |
0.6299 times |
Wed 09 July 2025 |
2.30 (-6.5%) |
2.48 |
2.27 - 2.52 |
1.1595 times |
Tue 08 July 2025 |
2.46 (-3.91%) |
2.51 |
2.42 - 2.64 |
1.0595 times |
Mon 07 July 2025 |
2.56 (-0.39%) |
2.57 |
2.45 - 2.57 |
0.8071 times |
Thu 03 July 2025 |
2.57 (8.9%) |
2.40 |
2.40 - 2.57 |
1.4817 times |
Wed 02 July 2025 |
2.36 (-0.42%) |
2.37 |
2.30 - 2.50 |
1.369 times |
Tue 01 July 2025 |
2.37 (3.49%) |
2.31 |
2.16 - 2.37 |
0.8676 times |
Mon 30 June 2025 |
2.29 (2.69%) |
2.26 |
2.16 - 2.38 |
0.8032 times |
Fri 27 June 2025 |
2.23 (-5.51%) |
2.40 |
2.19 - 2.40 |
0.9048 times |
Weekly price and charts IntrusionInc Strong weekly Stock price targets for IntrusionInc INTZ are 2.08 and 2.21 | Weekly Target 1 | 1.98 | | Weekly Target 2 | 2.05 | | Weekly Target 3 | 2.1133333333333 | | Weekly Target 4 | 2.18 | | Weekly Target 5 | 2.24 |
Weekly price and volumes for Intrusion Inc
| Date |
Closing |
Open |
Range |
Volume |
Mon 14 July 2025 |
2.11 (0.96%) |
2.09 |
2.05 - 2.18 |
0.0721 times |
Fri 11 July 2025 |
2.09 (-18.68%) |
2.57 |
2.08 - 2.64 |
0.699 times |
Thu 03 July 2025 |
2.57 (15.25%) |
2.26 |
2.16 - 2.57 |
0.6364 times |
Fri 27 June 2025 |
2.23 (0.45%) |
2.18 |
2.03 - 2.50 |
0.9307 times |
Fri 20 June 2025 |
2.22 (13.27%) |
2.10 |
2.04 - 2.30 |
0.4799 times |
Fri 13 June 2025 |
1.96 (-8.41%) |
2.25 |
1.86 - 2.58 |
2.1368 times |
Fri 06 June 2025 |
2.14 (64.62%) |
1.37 |
1.36 - 2.40 |
3.278 times |
Fri 30 May 2025 |
1.30 (-12.16%) |
1.50 |
1.28 - 1.52 |
0.4974 times |
Fri 23 May 2025 |
1.48 (-14.94%) |
1.67 |
1.44 - 1.72 |
0.5633 times |
Fri 16 May 2025 |
1.74 (20.83%) |
1.49 |
1.43 - 1.76 |
0.7062 times |
Fri 09 May 2025 |
1.44 (-5.88%) |
1.48 |
1.27 - 1.52 |
0.3913 times |

Monthly price and charts IntrusionInc Strong monthly Stock price targets for IntrusionInc INTZ are 1.79 and 2.38 | Monthly Target 1 | 1.68 | | Monthly Target 2 | 1.89 | | Monthly Target 3 | 2.2666666666667 | | Monthly Target 4 | 2.48 | | Monthly Target 5 | 2.86 |
Monthly price and volumes Intrusion Inc
| Date |
Closing |
Open |
Range |
Volume |
Mon 14 July 2025 |
2.11 (-7.86%) |
2.31 |
2.05 - 2.64 |
0.0635 times |
Mon 30 June 2025 |
2.29 (76.15%) |
1.37 |
1.36 - 2.58 |
0.3406 times |
Fri 30 May 2025 |
1.30 (3.17%) |
1.28 |
1.22 - 1.76 |
0.1231 times |
Wed 30 April 2025 |
1.26 (12.5%) |
1.13 |
0.75 - 1.42 |
0.0934 times |
Mon 31 March 2025 |
1.12 (31.76%) |
0.89 |
0.71 - 1.55 |
0.2366 times |
Fri 28 February 2025 |
0.85 (-50.87%) |
1.54 |
0.83 - 2.04 |
0.271 times |
Fri 31 January 2025 |
1.73 (-43.83%) |
4.03 |
1.53 - 5.20 |
2.6853 times |
Tue 31 December 2024 |
3.08 (431.03%) |
0.59 |
0.35 - 7.34 |
6.0886 times |
Tue 26 November 2024 |
0.58 (-25.64%) |
0.76 |
0.58 - 0.90 |
0.0465 times |
Thu 31 October 2024 |
0.78 (-9.3%) |
0.85 |
0.65 - 0.93 |
0.0513 times |
Mon 30 September 2024 |
0.86 (-30.08%) |
1.21 |
0.68 - 1.21 |
0.0546 times |

DMA SMA EMA moving averages of Intrusion Inc INTZ
DMA (daily moving average) of Intrusion Inc INTZ
| DMA period | DMA value | | 5 day DMA | 2.25 | | 12 day DMA | 2.33 | | 20 day DMA | 2.27 | | 35 day DMA | 2.06 | | 50 day DMA | 1.89 | | 100 day DMA | 1.51 | | 150 day DMA | 1.58 | | 200 day DMA | 1.38 | EMA (exponential moving average) of Intrusion Inc INTZ
| EMA period | EMA current | EMA prev | EMA prev2 | | 5 day EMA | 2.22 | 2.28 | 2.38 | | 12 day EMA | 2.27 | 2.3 | 2.34 | | 20 day EMA | 2.23 | 2.24 | 2.26 | | 35 day EMA | 2.06 | 2.06 | 2.06 | | 50 day EMA | 1.88 | 1.87 | 1.86 |
SMA (simple moving average) of Intrusion Inc INTZ
| SMA period | SMA current | SMA prev | SMA prev2 | | 5 day SMA | 2.25 | 2.34 | 2.44 | | 12 day SMA | 2.33 | 2.36 | 2.37 | | 20 day SMA | 2.27 | 2.28 | 2.29 | | 35 day SMA | 2.06 | 2.04 | 2.03 | | 50 day SMA | 1.89 | 1.88 | 1.86 | | 100 day SMA | 1.51 | 1.51 | 1.5 | | 150 day SMA | 1.58 | 1.57 | 1.56 | | 200 day SMA | 1.38 | 1.38 | 1.37 |
|
|
