IntuitInc INTU full analysis,charts,indicators,moving averages,SMA,DMA,EMA,ADX,MACD,RSIIntuit Inc INTU WideScreen charts, DMA,SMA,EMA technical analysis, forecast prediction, by indicators ADX,MACD,RSI,CCI NASDAQ stock exchange
operates under Technology sector & deals in Computer Software Prepackaged Software
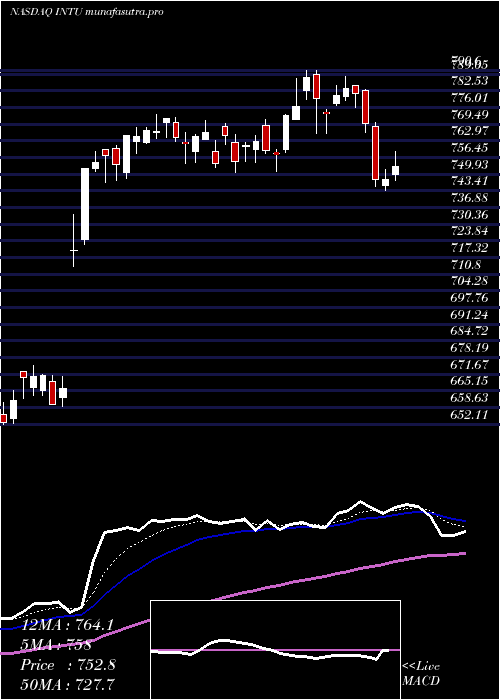
Daily price and charts and targets IntuitInc Strong Daily Stock price targets for IntuitInc INTU are 804.18 and 816.92 | Daily Target 1 | 794.61 | | Daily Target 2 | 801 | | Daily Target 3 | 807.35 | | Daily Target 4 | 813.74 | | Daily Target 5 | 820.09 |
Daily price and volume Intuit Inc
| Date |
Closing |
Open |
Range |
Volume |
Wed 30 July 2025 |
807.39 (0.13%) |
804.87 |
800.96 - 813.70 |
1.0727 times |
Tue 29 July 2025 |
806.34 (0.95%) |
804.48 |
794.83 - 807.93 |
1.1312 times |
Mon 28 July 2025 |
798.73 (1.63%) |
785.03 |
783.00 - 800.50 |
1.2911 times |
Fri 25 July 2025 |
785.95 (0.61%) |
782.91 |
780.50 - 790.50 |
0.9392 times |
Thu 24 July 2025 |
781.21 (0.67%) |
778.00 |
775.28 - 784.17 |
0.9215 times |
Wed 23 July 2025 |
776.00 (1.2%) |
765.79 |
759.53 - 778.06 |
1.2955 times |
Tue 22 July 2025 |
766.78 (0.4%) |
767.45 |
760.30 - 771.12 |
0.6862 times |
Mon 21 July 2025 |
763.69 (1.47%) |
753.98 |
751.51 - 767.93 |
0.9428 times |
Fri 18 July 2025 |
752.63 (-0.36%) |
763.23 |
750.84 - 763.23 |
1.005 times |
Thu 17 July 2025 |
755.37 (0.62%) |
749.21 |
748.91 - 756.45 |
0.7148 times |
Wed 16 July 2025 |
750.72 (0.64%) |
751.80 |
742.39 - 751.80 |
0.8436 times |
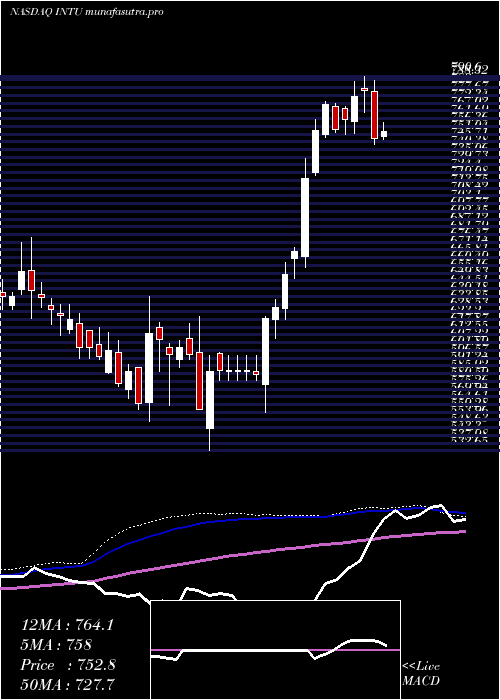
Weekly price and charts IntuitInc Strong weekly Stock price targets for IntuitInc INTU are 795.2 and 825.9 | Weekly Target 1 | 770.66 | | Weekly Target 2 | 789.03 | | Weekly Target 3 | 801.36333333333 | | Weekly Target 4 | 819.73 | | Weekly Target 5 | 832.06 |
Weekly price and volumes for Intuit Inc
| Date |
Closing |
Open |
Range |
Volume |
Wed 30 July 2025 |
807.39 (2.73%) |
785.03 |
783.00 - 813.70 |
0.733 times |
Fri 25 July 2025 |
785.95 (4.43%) |
753.98 |
751.51 - 790.50 |
1.0036 times |
Fri 18 July 2025 |
752.63 (0.63%) |
749.59 |
742.39 - 763.23 |
0.8972 times |
Fri 11 July 2025 |
747.90 (-4.19%) |
780.27 |
743.50 - 788.13 |
0.9877 times |
Thu 03 July 2025 |
780.64 (0.52%) |
782.52 |
765.81 - 790.60 |
0.8666 times |
Fri 27 June 2025 |
776.57 (2.03%) |
759.67 |
751.06 - 787.22 |
1.1382 times |
Fri 20 June 2025 |
761.14 (0.95%) |
768.46 |
750.38 - 769.64 |
0.8793 times |
Fri 13 June 2025 |
753.98 (-2.28%) |
770.22 |
752.34 - 772.00 |
0.909 times |
Fri 06 June 2025 |
771.58 (2.4%) |
750.55 |
748.34 - 773.45 |
1.0359 times |
Fri 30 May 2025 |
753.47 (4.63%) |
724.51 |
722.45 - 761.02 |
1.5494 times |
Fri 23 May 2025 |
720.13 (7.44%) |
666.46 |
659.00 - 734.18 |
1.6084 times |
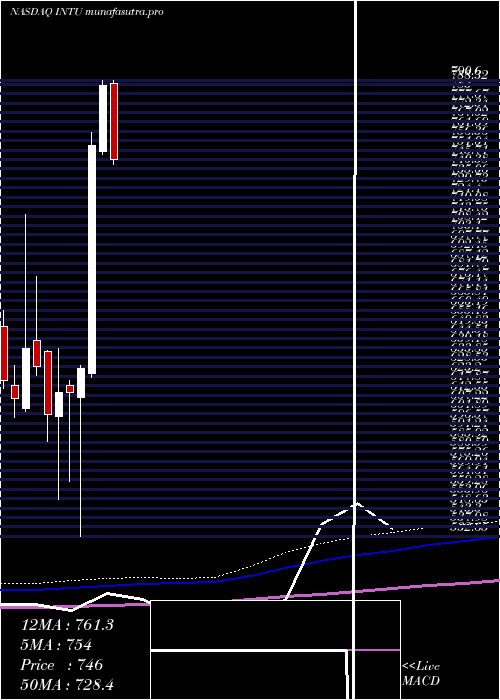
Monthly price and charts IntuitInc Strong monthly Stock price targets for IntuitInc INTU are 774.89 and 846.2 | Monthly Target 1 | 716.52 | | Monthly Target 2 | 761.95 | | Monthly Target 3 | 787.82666666667 | | Monthly Target 4 | 833.26 | | Monthly Target 5 | 859.14 |
Monthly price and volumes Intuit Inc
| Date |
Closing |
Open |
Range |
Volume |
Wed 30 July 2025 |
807.39 (2.51%) |
788.70 |
742.39 - 813.70 |
0.8837 times |
Mon 30 June 2025 |
787.63 (4.53%) |
750.55 |
748.34 - 790.50 |
0.8879 times |
Fri 30 May 2025 |
753.47 (20.08%) |
624.49 |
622.42 - 761.02 |
1.2047 times |
Wed 30 April 2025 |
627.47 (2.2%) |
610.87 |
532.65 - 629.31 |
1.1008 times |
Mon 31 March 2025 |
613.99 (0.02%) |
617.86 |
563.72 - 620.81 |
1.0064 times |
Fri 28 February 2025 |
613.84 (2.05%) |
600.40 |
553.24 - 638.99 |
1.1939 times |
Fri 31 January 2025 |
601.51 (-4.29%) |
637.00 |
586.00 - 637.73 |
1.1144 times |
Tue 31 December 2024 |
628.50 (-1.62%) |
643.61 |
623.41 - 679.85 |
0.7043 times |
Tue 26 November 2024 |
638.83 (4.67%) |
605.00 |
603.00 - 714.78 |
1.0819 times |
Thu 31 October 2024 |
610.30 (-1.72%) |
618.02 |
599.65 - 629.47 |
0.8221 times |
Mon 30 September 2024 |
621.00 (-1.47%) |
632.64 |
611.81 - 660.90 |
0.7298 times |
DMA SMA EMA moving averages of Intuit Inc INTU
DMA (daily moving average) of Intuit Inc INTU
| DMA period | DMA value | | 5 day DMA | 795.92 | | 12 day DMA | 774.23 | | 20 day DMA | 771.42 | | 35 day DMA | 769.05 | | 50 day DMA | 756.54 | | 100 day DMA | 681.52 | | 150 day DMA | 655.8 | | 200 day DMA | 652 | EMA (exponential moving average) of Intuit Inc INTU
| EMA period | EMA current | EMA prev | EMA prev2 | | 5 day EMA | 796.5 | 791.06 | 783.42 | | 12 day EMA | 782.79 | 778.32 | 773.23 | | 20 day EMA | 775.03 | 771.63 | 767.98 | | 35 day EMA | 761.81 | 759.13 | 756.35 | | 50 day EMA | 752.44 | 750.2 | 747.91 |
SMA (simple moving average) of Intuit Inc INTU
| SMA period | SMA current | SMA prev | SMA prev2 | | 5 day SMA | 795.92 | 789.65 | 781.73 | | 12 day SMA | 774.23 | 769.68 | 764.81 | | 20 day SMA | 771.42 | 770.03 | 769.09 | | 35 day SMA | 769.05 | 768.03 | 766.89 | | 50 day SMA | 756.54 | 753.62 | 750.55 | | 100 day SMA | 681.52 | 679.51 | 677.62 | | 150 day SMA | 655.8 | 654.67 | 653.59 | | 200 day SMA | 652 | 650.98 | 649.99 |
|
|
