IntergroupCorporation INTG full analysis,charts,indicators,moving averages,SMA,DMA,EMA,ADX,MACD,RSIIntergroup Corporation INTG WideScreen charts, DMA,SMA,EMA technical analysis, forecast prediction, by indicators ADX,MACD,RSI,CCI NASDAQ stock exchange
operates under Consumer Services sector & deals in Building Operators
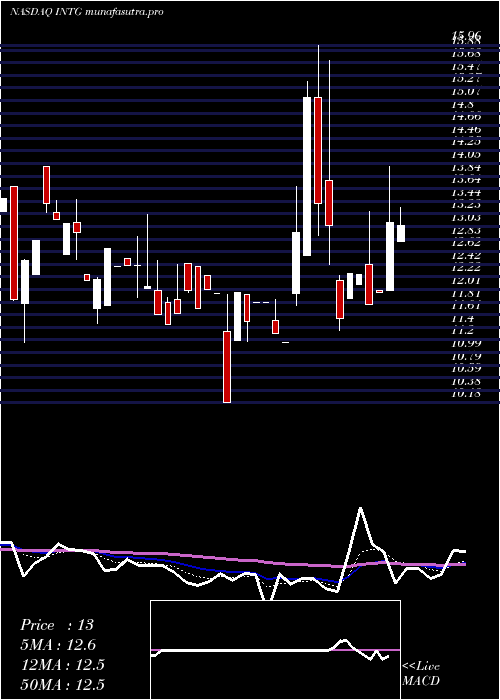
Daily price and charts and targets IntergroupCorporation Strong Daily Stock price targets for IntergroupCorporation INTG are 10.61 and 11.48 | Daily Target 1 | 10.45 | | Daily Target 2 | 10.76 | | Daily Target 3 | 11.323333333333 | | Daily Target 4 | 11.63 | | Daily Target 5 | 12.19 |
Daily price and volume Intergroup Corporation
| Date |
Closing |
Open |
Range |
Volume |
Fri 01 August 2025 |
11.06 (-5.87%) |
11.70 |
11.02 - 11.89 |
0.5954 times |
Thu 31 July 2025 |
11.75 (9.81%) |
10.61 |
10.61 - 11.78 |
1.2168 times |
Wed 30 July 2025 |
10.70 (6.68%) |
10.80 |
10.67 - 11.01 |
2.1488 times |
Tue 29 July 2025 |
10.03 (-6.78%) |
11.15 |
9.57 - 11.15 |
2.6924 times |
Mon 28 July 2025 |
10.76 (-2.54%) |
11.41 |
10.76 - 11.41 |
0.1553 times |
Wed 23 July 2025 |
11.04 (-1.25%) |
11.04 |
11.04 - 11.04 |
0.1553 times |
Tue 22 July 2025 |
11.18 (3.9%) |
12.04 |
11.18 - 12.04 |
0.5437 times |
Mon 21 July 2025 |
10.76 (-4.27%) |
10.76 |
10.76 - 10.76 |
0.0777 times |
Fri 18 July 2025 |
11.24 (3.12%) |
11.84 |
11.24 - 11.84 |
0.4173 times |
Thu 17 July 2025 |
10.90 (-1.8%) |
11.98 |
10.81 - 12.95 |
1.9973 times |
Wed 16 July 2025 |
11.10 (-14.88%) |
14.00 |
11.10 - 14.00 |
1.7345 times |
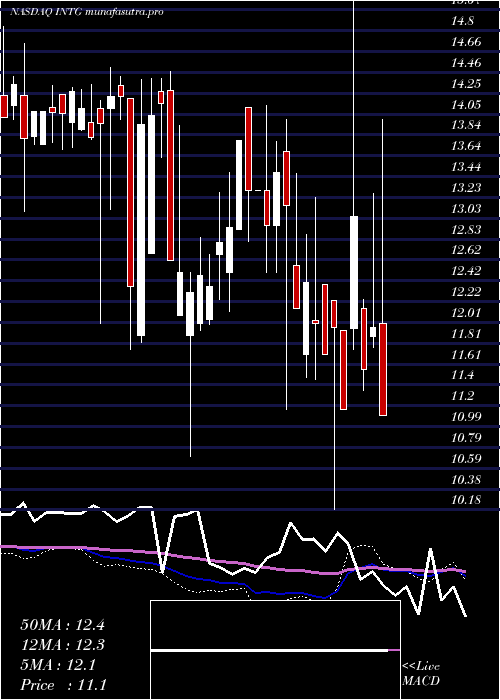
Weekly price and charts IntergroupCorporation Strong weekly Stock price targets for IntergroupCorporation INTG are 9.16 and 11.48 | Weekly Target 1 | 8.52 | | Weekly Target 2 | 9.79 | | Weekly Target 3 | 10.84 | | Weekly Target 4 | 12.11 | | Weekly Target 5 | 13.16 |
Weekly price and volumes for Intergroup Corporation
| Date |
Closing |
Open |
Range |
Volume |
Fri 01 August 2025 |
11.06 (0.18%) |
11.41 |
9.57 - 11.89 |
1.279 times |
Wed 23 July 2025 |
11.04 (-1.78%) |
10.76 |
10.76 - 12.04 |
0.1459 times |
Fri 18 July 2025 |
11.24 (-6.02%) |
12.00 |
10.81 - 14.00 |
1.3533 times |
Fri 11 July 2025 |
11.96 (3.55%) |
11.87 |
11.77 - 13.27 |
0.2772 times |
Mon 30 June 2025 |
11.55 (-11.49%) |
12.15 |
11.35 - 12.24 |
0.0875 times |
Fri 27 June 2025 |
13.05 (16.94%) |
11.95 |
11.75 - 15.96 |
5.9914 times |
Fri 20 June 2025 |
11.16 (-6.69%) |
11.93 |
11.16 - 11.93 |
0.2043 times |
Fri 06 June 2025 |
11.96 (2.22%) |
12.23 |
10.18 - 12.23 |
0.2432 times |
Fri 30 May 2025 |
11.70 (-2.5%) |
12.38 |
11.70 - 12.38 |
0.0243 times |
Fri 23 May 2025 |
12.00 (-3.23%) |
12.03 |
11.45 - 13.23 |
0.3939 times |
Fri 16 May 2025 |
12.40 (2.06%) |
11.70 |
11.47 - 12.87 |
0.5058 times |
Monthly price and charts IntergroupCorporation Strong monthly Stock price targets for IntergroupCorporation INTG are 10.61 and 11.48 | Monthly Target 1 | 10.45 | | Monthly Target 2 | 10.76 | | Monthly Target 3 | 11.323333333333 | | Monthly Target 4 | 11.63 | | Monthly Target 5 | 12.19 |
Monthly price and volumes Intergroup Corporation
| Date |
Closing |
Open |
Range |
Volume |
Fri 01 August 2025 |
11.06 (-5.87%) |
11.70 |
11.02 - 11.89 |
0.0406 times |
Thu 31 July 2025 |
11.75 (1.73%) |
11.87 |
9.57 - 14.00 |
1.0679 times |
Mon 30 June 2025 |
11.55 (-1.28%) |
12.23 |
10.18 - 15.96 |
2.3678 times |
Fri 30 May 2025 |
11.70 (-8.59%) |
14.00 |
11.45 - 14.00 |
0.4782 times |
Wed 30 April 2025 |
12.80 (5.61%) |
12.79 |
11.16 - 14.13 |
0.9411 times |
Mon 31 March 2025 |
12.12 (-3.04%) |
11.89 |
10.70 - 13.28 |
1.0328 times |
Fri 28 February 2025 |
12.50 (-10.39%) |
12.69 |
12.08 - 14.46 |
0.4411 times |
Fri 31 January 2025 |
13.95 (-2.24%) |
14.07 |
11.75 - 14.50 |
1.7165 times |
Tue 31 December 2024 |
14.27 (1.42%) |
14.11 |
13.70 - 14.33 |
0.5025 times |
Tue 26 November 2024 |
14.07 (-2.16%) |
14.60 |
13.10 - 15.00 |
1.4115 times |
Thu 31 October 2024 |
14.38 (-6.87%) |
15.32 |
13.65 - 16.68 |
3.0877 times |
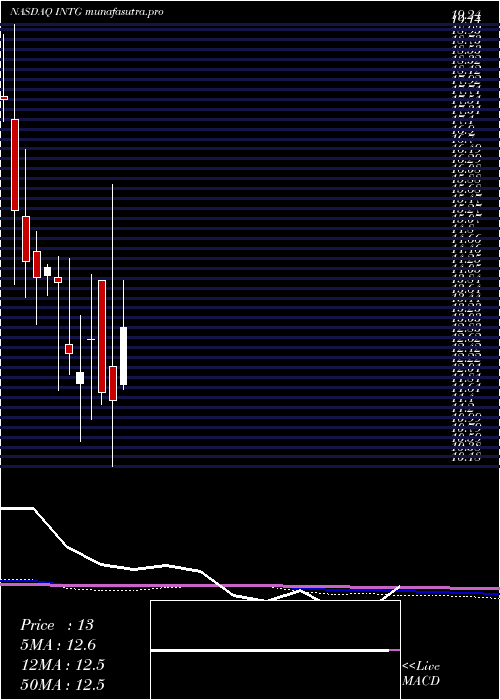
DMA SMA EMA moving averages of Intergroup Corporation INTG
DMA (daily moving average) of Intergroup Corporation INTG
| DMA period | DMA value | | 5 day DMA | 10.86 | | 12 day DMA | 11.13 | | 20 day DMA | 11.65 | | 35 day DMA | 11.75 | | 50 day DMA | 11.98 | | 100 day DMA | 12.46 | | 150 day DMA | 12.95 | | 200 day DMA | 13.54 | EMA (exponential moving average) of Intergroup Corporation INTG
| EMA period | EMA current | EMA prev | EMA prev2 | | 5 day EMA | 11.05 | 11.05 | 10.7 | | 12 day EMA | 11.2 | 11.23 | 11.14 | | 20 day EMA | 11.44 | 11.48 | 11.45 | | 35 day EMA | 11.74 | 11.78 | 11.78 | | 50 day EMA | 11.99 | 12.03 | 12.04 |
SMA (simple moving average) of Intergroup Corporation INTG
| SMA period | SMA current | SMA prev | SMA prev2 | | 5 day SMA | 10.86 | 10.86 | 10.74 | | 12 day SMA | 11.13 | 11.3 | 11.32 | | 20 day SMA | 11.65 | 11.85 | 11.91 | | 35 day SMA | 11.75 | 11.77 | 11.78 | | 50 day SMA | 11.98 | 12.03 | 12.07 | | 100 day SMA | 12.46 | 12.49 | 12.51 | | 150 day SMA | 12.95 | 12.97 | 12.98 | | 200 day SMA | 13.54 | 13.58 | 13.61 |
|
|
