IntelCorporation INTC full analysis,charts,indicators,moving averages,SMA,DMA,EMA,ADX,MACD,RSIIntel Corporation INTC WideScreen charts, DMA,SMA,EMA technical analysis, forecast prediction, by indicators ADX,MACD,RSI,CCI NASDAQ stock exchange
operates under Technology sector & deals in Semiconductors
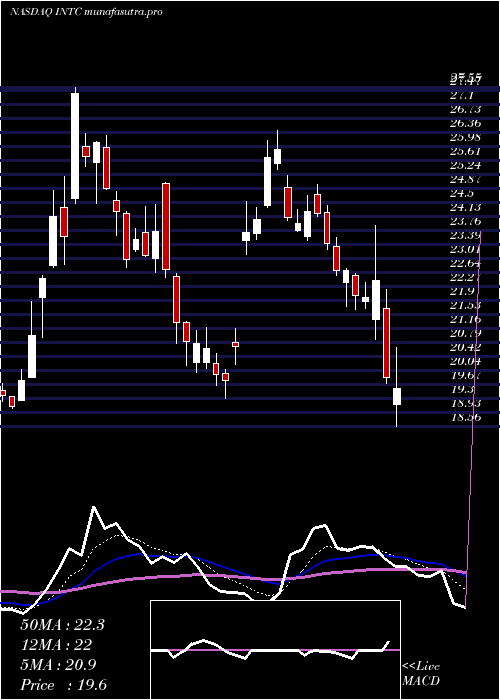
Daily price and charts and targets IntelCorporation Strong Daily Stock price targets for IntelCorporation INTC are 38.53 and 42.13 | Daily Target 1 | 37.87 | | Daily Target 2 | 39.19 | | Daily Target 3 | 41.466666666667 | | Daily Target 4 | 42.79 | | Daily Target 5 | 45.07 |
Daily price and volume Intel Corporation
| Date |
Closing |
Open |
Range |
Volume |
Thu 04 December 2025 |
40.52 (-7.4%) |
43.74 |
40.14 - 43.74 |
1.0686 times |
Wed 03 December 2025 |
43.76 (0.64%) |
43.38 |
42.51 - 44.02 |
1.1345 times |
Tue 02 December 2025 |
43.48 (8.67%) |
40.04 |
39.95 - 43.68 |
1.508 times |
Mon 01 December 2025 |
40.01 (-1.36%) |
39.86 |
39.60 - 40.38 |
0.9184 times |
Fri 28 November 2025 |
40.56 (10.31%) |
37.40 |
37.34 - 40.59 |
1.1819 times |
Wed 26 November 2025 |
36.77 (2.68%) |
36.28 |
35.95 - 37.24 |
0.493 times |
Tue 25 November 2025 |
35.81 (0.22%) |
35.55 |
34.68 - 37.11 |
0.4998 times |
Mon 24 November 2025 |
35.73 (3.57%) |
34.89 |
34.43 - 36.16 |
0.705 times |
Fri 21 November 2025 |
34.50 (2.62%) |
33.51 |
32.89 - 34.98 |
1.3017 times |
Thu 20 November 2025 |
33.62 (-4.24%) |
36.00 |
33.48 - 36.68 |
1.1892 times |
Wed 19 November 2025 |
35.11 (2.3%) |
34.33 |
34.25 - 35.75 |
0.828 times |
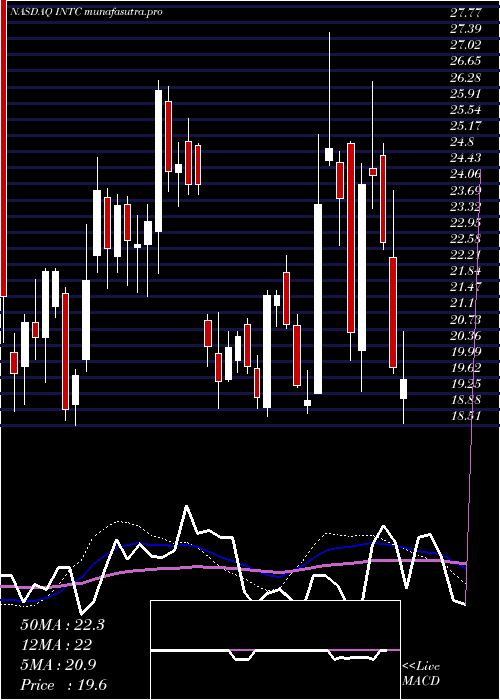
Weekly price and charts IntelCorporation Strong weekly Stock price targets for IntelCorporation INTC are 40.06 and 44.48 | Weekly Target 1 | 36.96 | | Weekly Target 2 | 38.74 | | Weekly Target 3 | 41.38 | | Weekly Target 4 | 43.16 | | Weekly Target 5 | 45.8 |
Weekly price and volumes for Intel Corporation
| Date |
Closing |
Open |
Range |
Volume |
Thu 04 December 2025 |
40.52 (-0.1%) |
39.86 |
39.60 - 44.02 |
0.9612 times |
Fri 28 November 2025 |
40.56 (17.57%) |
34.89 |
34.43 - 40.59 |
0.5979 times |
Fri 21 November 2025 |
34.50 (-2.87%) |
35.45 |
32.89 - 36.68 |
0.9986 times |
Fri 14 November 2025 |
35.52 (-6.92%) |
38.93 |
34.62 - 39.53 |
0.7948 times |
Fri 07 November 2025 |
38.16 (-4.58%) |
38.14 |
35.92 - 39.84 |
0.7492 times |
Fri 31 October 2025 |
39.99 (0%) |
40.68 |
39.79 - 40.83 |
0.2061 times |
Fri 31 October 2025 |
39.99 (4.52%) |
38.39 |
38.23 - 42.48 |
1.5706 times |
Fri 24 October 2025 |
38.26 (2.99%) |
37.68 |
36.04 - 41.12 |
1.313 times |
Fri 17 October 2025 |
37.15 (2.14%) |
36.44 |
34.69 - 38.38 |
1.2994 times |
Fri 10 October 2025 |
36.37 (-0.98%) |
36.95 |
35.70 - 39.65 |
1.5092 times |
Fri 03 October 2025 |
36.73 (3.46%) |
34.52 |
33.02 - 38.68 |
1.7757 times |
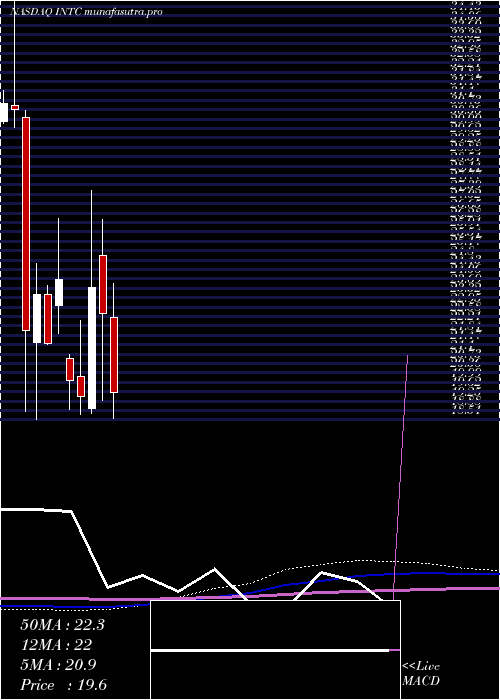
Monthly price and charts IntelCorporation Strong monthly Stock price targets for IntelCorporation INTC are 40.06 and 44.48 | Monthly Target 1 | 36.96 | | Monthly Target 2 | 38.74 | | Monthly Target 3 | 41.38 | | Monthly Target 4 | 43.16 | | Monthly Target 5 | 45.8 |
Monthly price and volumes Intel Corporation
| Date |
Closing |
Open |
Range |
Volume |
Thu 04 December 2025 |
40.52 (-0.1%) |
39.86 |
39.60 - 44.02 |
0.1951 times |
Fri 28 November 2025 |
40.56 (1.43%) |
38.14 |
32.89 - 40.59 |
0.6374 times |
Fri 31 October 2025 |
39.99 (19.2%) |
33.53 |
33.50 - 42.48 |
1.4135 times |
Tue 30 September 2025 |
33.55 (37.78%) |
23.88 |
23.68 - 36.30 |
1.4039 times |
Fri 29 August 2025 |
24.35 (22.98%) |
19.50 |
18.97 - 26.53 |
1.4698 times |
Thu 31 July 2025 |
19.80 (-11.61%) |
22.33 |
19.66 - 24.04 |
0.9573 times |
Mon 30 June 2025 |
22.40 (14.58%) |
19.48 |
19.37 - 23.38 |
0.9185 times |
Fri 30 May 2025 |
19.55 (-2.74%) |
20.22 |
19.31 - 22.88 |
0.7268 times |
Wed 30 April 2025 |
20.10 (-11.49%) |
22.56 |
17.67 - 23.90 |
1.1961 times |
Mon 31 March 2025 |
22.71 (-4.3%) |
25.00 |
19.29 - 26.41 |
1.0815 times |
Fri 28 February 2025 |
23.73 (22.13%) |
18.97 |
18.78 - 27.55 |
1.2009 times |
DMA SMA EMA moving averages of Intel Corporation INTC
DMA (daily moving average) of Intel Corporation INTC
| DMA period | DMA value | | 5 day DMA | 41.67 | | 12 day DMA | 37.85 | | 20 day DMA | 37.5 | | 35 day DMA | 38.03 | | 50 day DMA | 37.48 | | 100 day DMA | 30.62 | | 150 day DMA | 27.54 | | 200 day DMA | 26.09 | EMA (exponential moving average) of Intel Corporation INTC
| EMA period | EMA current | EMA prev | EMA prev2 | | 5 day EMA | 41.01 | 41.25 | 40 | | 12 day EMA | 39.23 | 39 | 38.13 | | 20 day EMA | 38.43 | 38.21 | 37.63 | | 35 day EMA | 37.51 | 37.33 | 36.95 | | 50 day EMA | 37.28 | 37.15 | 36.88 |
SMA (simple moving average) of Intel Corporation INTC
| SMA period | SMA current | SMA prev | SMA prev2 | | 5 day SMA | 41.67 | 40.92 | 39.33 | | 12 day SMA | 37.85 | 37.37 | 36.68 | | 20 day SMA | 37.5 | 37.39 | 37.05 | | 35 day SMA | 38.03 | 37.93 | 37.7 | | 50 day SMA | 37.48 | 37.29 | 37.01 | | 100 day SMA | 30.62 | 30.45 | 30.24 | | 150 day SMA | 27.54 | 27.4 | 27.25 | | 200 day SMA | 26.09 | 26.03 | 25.93 |
|
|
