InogenInc INGN full analysis,charts,indicators,moving averages,SMA,DMA,EMA,ADX,MACD,RSIInogen Inc INGN WideScreen charts, DMA,SMA,EMA technical analysis, forecast prediction, by indicators ADX,MACD,RSI,CCI NASDAQ stock exchange
operates under Health Care sector & deals in Industrial Specialties
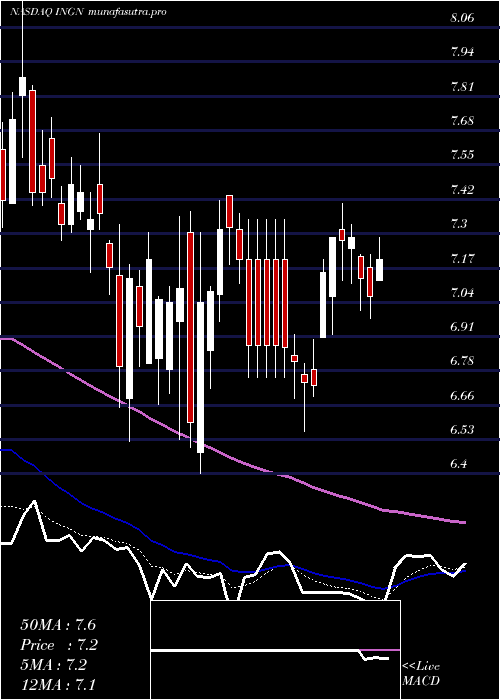
Daily price and charts and targets InogenInc Strong Daily Stock price targets for InogenInc INGN are 6.85 and 6.99 | Daily Target 1 | 6.82 | | Daily Target 2 | 6.88 | | Daily Target 3 | 6.96 | | Daily Target 4 | 7.02 | | Daily Target 5 | 7.1 |
Daily price and volume Inogen Inc
| Date |
Closing |
Open |
Range |
Volume |
Fri 05 December 2025 |
6.94 (-0.72%) |
7.01 |
6.90 - 7.04 |
0.7818 times |
Thu 04 December 2025 |
6.99 (1.16%) |
6.89 |
6.81 - 7.00 |
1.1328 times |
Wed 03 December 2025 |
6.91 (2.52%) |
6.79 |
6.70 - 6.93 |
1.093 times |
Tue 02 December 2025 |
6.74 (-3.02%) |
6.98 |
6.72 - 7.12 |
1.0955 times |
Mon 01 December 2025 |
6.95 (-1.84%) |
7.07 |
6.91 - 7.12 |
0.9722 times |
Fri 28 November 2025 |
7.08 (-0.56%) |
7.13 |
7.01 - 7.23 |
0.4369 times |
Wed 26 November 2025 |
7.12 (0.42%) |
7.06 |
6.92 - 7.16 |
0.7475 times |
Tue 25 November 2025 |
7.09 (0.14%) |
7.10 |
6.95 - 7.20 |
0.7675 times |
Mon 24 November 2025 |
7.08 (2.91%) |
6.88 |
6.77 - 7.14 |
1.2959 times |
Fri 21 November 2025 |
6.88 (4.4%) |
6.59 |
6.58 - 6.99 |
1.6768 times |
Thu 20 November 2025 |
6.59 (-1.49%) |
6.81 |
6.56 - 6.90 |
1.7652 times |
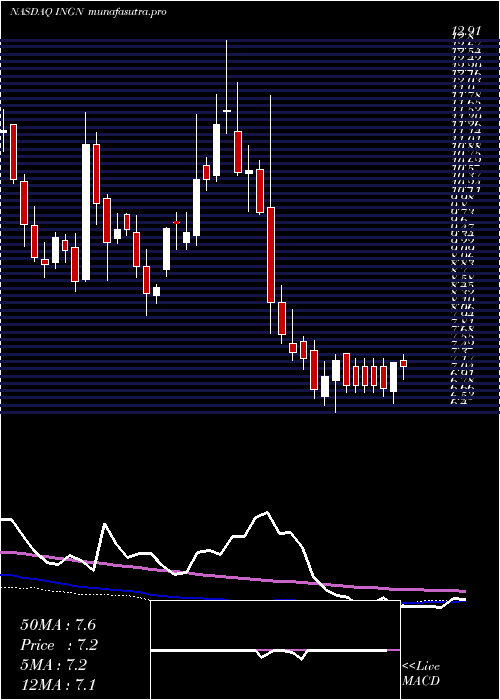
Weekly price and charts InogenInc Strong weekly Stock price targets for InogenInc INGN are 6.61 and 7.03 | Weekly Target 1 | 6.5 | | Weekly Target 2 | 6.72 | | Weekly Target 3 | 6.92 | | Weekly Target 4 | 7.14 | | Weekly Target 5 | 7.34 |
Weekly price and volumes for Inogen Inc
| Date |
Closing |
Open |
Range |
Volume |
Fri 05 December 2025 |
6.94 (-1.98%) |
7.07 |
6.70 - 7.12 |
1.045 times |
Fri 28 November 2025 |
7.08 (2.91%) |
6.88 |
6.77 - 7.23 |
0.6687 times |
Fri 21 November 2025 |
6.88 (-0.29%) |
6.85 |
6.56 - 7.01 |
1.6449 times |
Fri 14 November 2025 |
6.90 (-1.29%) |
7.00 |
6.78 - 7.25 |
1.1981 times |
Fri 07 November 2025 |
6.99 (-15.17%) |
8.12 |
6.95 - 8.29 |
1.533 times |
Fri 31 October 2025 |
8.24 (0%) |
8.15 |
8.11 - 8.29 |
0.1156 times |
Fri 31 October 2025 |
8.24 (-6.04%) |
8.77 |
8.06 - 8.94 |
0.8096 times |
Fri 24 October 2025 |
8.77 (4.78%) |
8.46 |
8.24 - 9.13 |
1.0864 times |
Fri 17 October 2025 |
8.37 (2.57%) |
8.27 |
7.82 - 8.75 |
0.9634 times |
Fri 10 October 2025 |
8.16 (-5.66%) |
8.75 |
8.10 - 8.84 |
0.9353 times |
Fri 03 October 2025 |
8.65 (5.23%) |
8.24 |
8.06 - 8.78 |
1.1705 times |
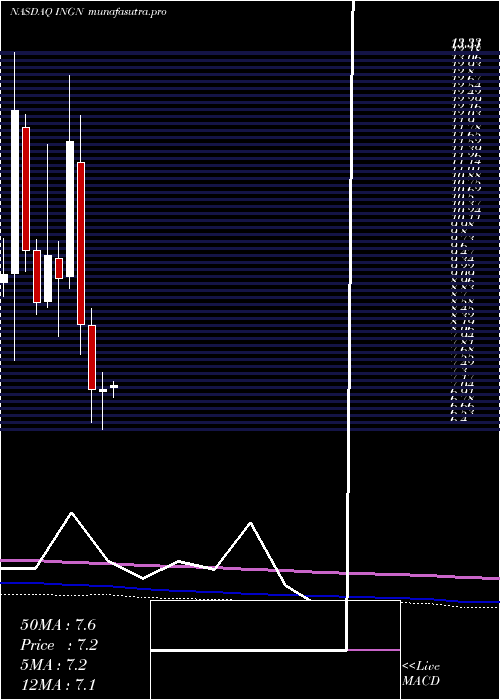
Monthly price and charts InogenInc Strong monthly Stock price targets for InogenInc INGN are 6.61 and 7.03 | Monthly Target 1 | 6.5 | | Monthly Target 2 | 6.72 | | Monthly Target 3 | 6.92 | | Monthly Target 4 | 7.14 | | Monthly Target 5 | 7.34 |
Monthly price and volumes Inogen Inc
| Date |
Closing |
Open |
Range |
Volume |
Fri 05 December 2025 |
6.94 (-1.98%) |
7.07 |
6.70 - 7.12 |
0.1838 times |
Fri 28 November 2025 |
7.08 (-14.08%) |
8.12 |
6.56 - 8.29 |
0.8874 times |
Fri 31 October 2025 |
8.24 (0.86%) |
8.11 |
7.82 - 9.13 |
0.7887 times |
Tue 30 September 2025 |
8.17 (2.25%) |
7.86 |
7.72 - 8.86 |
0.998 times |
Fri 29 August 2025 |
7.99 (26.62%) |
6.25 |
5.85 - 8.18 |
1.2456 times |
Thu 31 July 2025 |
6.31 (-10.24%) |
6.98 |
6.27 - 7.61 |
0.8752 times |
Mon 30 June 2025 |
7.03 (9.33%) |
6.42 |
6.23 - 7.30 |
0.8326 times |
Fri 30 May 2025 |
6.43 (-9.82%) |
7.17 |
5.70 - 7.29 |
1.4528 times |
Wed 30 April 2025 |
7.13 (0%) |
7.10 |
6.40 - 7.44 |
1.3546 times |
Mon 31 March 2025 |
7.13 (-14.41%) |
8.32 |
6.52 - 8.63 |
1.3813 times |
Fri 28 February 2025 |
8.33 (-28.74%) |
11.31 |
7.78 - 12.17 |
1.5638 times |
DMA SMA EMA moving averages of Inogen Inc INGN
DMA (daily moving average) of Inogen Inc INGN
| DMA period | DMA value | | 5 day DMA | 6.91 | | 12 day DMA | 6.92 | | 20 day DMA | 6.92 | | 35 day DMA | 7.52 | | 50 day DMA | 7.78 | | 100 day DMA | 7.67 | | 150 day DMA | 7.33 | | 200 day DMA | 7.36 | EMA (exponential moving average) of Inogen Inc INGN
| EMA period | EMA current | EMA prev | EMA prev2 | | 5 day EMA | 6.94 | 6.94 | 6.91 | | 12 day EMA | 6.97 | 6.98 | 6.98 | | 20 day EMA | 7.1 | 7.12 | 7.13 | | 35 day EMA | 7.38 | 7.41 | 7.44 | | 50 day EMA | 7.75 | 7.78 | 7.81 |
SMA (simple moving average) of Inogen Inc INGN
| SMA period | SMA current | SMA prev | SMA prev2 | | 5 day SMA | 6.91 | 6.93 | 6.96 | | 12 day SMA | 6.92 | 6.91 | 6.89 | | 20 day SMA | 6.92 | 6.93 | 6.95 | | 35 day SMA | 7.52 | 7.57 | 7.61 | | 50 day SMA | 7.78 | 7.81 | 7.84 | | 100 day SMA | 7.67 | 7.66 | 7.66 | | 150 day SMA | 7.33 | 7.33 | 7.33 | | 200 day SMA | 7.36 | 7.38 | 7.4 |
|
|
