IlluminaInc ILMN full analysis,charts,indicators,moving averages,SMA,DMA,EMA,ADX,MACD,RSIIllumina Inc ILMN WideScreen charts, DMA,SMA,EMA technical analysis, forecast prediction, by indicators ADX,MACD,RSI,CCI NASDAQ stock exchange
operates under Capital Goods sector & deals in Biotechnology Laboratory Analytical Instruments
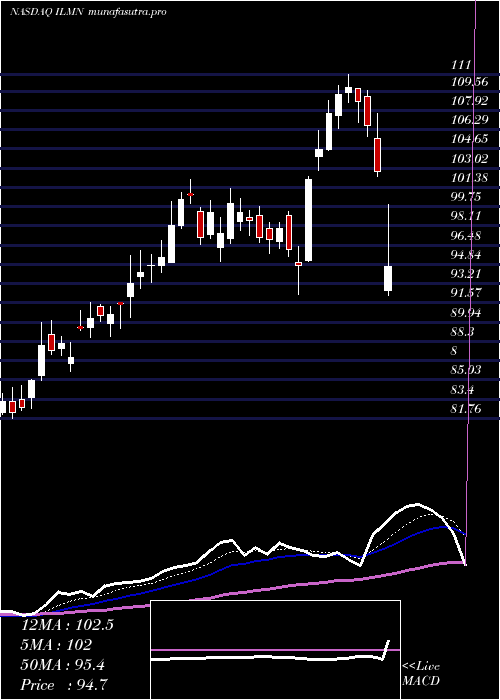
Daily price and charts and targets IlluminaInc Strong Daily Stock price targets for IlluminaInc ILMN are 128.3 and 129.93 | Daily Target 1 | 126.99 | | Daily Target 2 | 127.98 | | Daily Target 3 | 128.62333333333 | | Daily Target 4 | 129.61 | | Daily Target 5 | 130.25 |
Daily price and volume Illumina Inc
| Date |
Closing |
Open |
Range |
Volume |
Fri 05 December 2025 |
128.96 (0.73%) |
128.42 |
127.64 - 129.27 |
0.6048 times |
Thu 04 December 2025 |
128.03 (0.06%) |
127.08 |
124.27 - 128.28 |
0.6968 times |
Wed 03 December 2025 |
127.95 (0.31%) |
128.37 |
127.51 - 129.72 |
0.6111 times |
Tue 02 December 2025 |
127.55 (-0.91%) |
129.01 |
127.43 - 129.50 |
0.8018 times |
Mon 01 December 2025 |
128.72 (-2.08%) |
129.88 |
128.27 - 132.15 |
1.4201 times |
Fri 28 November 2025 |
131.45 (1.26%) |
130.00 |
129.27 - 131.48 |
0.7096 times |
Wed 26 November 2025 |
129.81 (0.13%) |
128.82 |
128.45 - 130.57 |
1.5292 times |
Tue 25 November 2025 |
129.64 (2.94%) |
125.76 |
125.50 - 130.47 |
1.1666 times |
Mon 24 November 2025 |
125.94 (1.69%) |
124.76 |
123.33 - 127.88 |
0.717 times |
Fri 21 November 2025 |
123.85 (3.85%) |
119.26 |
118.97 - 125.41 |
1.7429 times |
Thu 20 November 2025 |
119.26 (-0.72%) |
122.65 |
117.86 - 126.94 |
1.7701 times |
Weekly price and charts IlluminaInc Strong weekly Stock price targets for IlluminaInc ILMN are 122.68 and 130.56 | Weekly Target 1 | 120.58 | | Weekly Target 2 | 124.77 | | Weekly Target 3 | 128.46 | | Weekly Target 4 | 132.65 | | Weekly Target 5 | 136.34 |
Weekly price and volumes for Illumina Inc
| Date |
Closing |
Open |
Range |
Volume |
Fri 05 December 2025 |
128.96 (-1.89%) |
129.88 |
124.27 - 132.15 |
0.7313 times |
Fri 28 November 2025 |
131.45 (6.14%) |
124.76 |
123.33 - 131.48 |
0.7292 times |
Fri 21 November 2025 |
123.85 (2.64%) |
119.15 |
117.50 - 126.94 |
1.275 times |
Fri 14 November 2025 |
120.67 (-1.01%) |
123.00 |
117.10 - 125.50 |
0.9681 times |
Fri 07 November 2025 |
121.90 (-1.33%) |
117.90 |
116.21 - 126.00 |
0.8042 times |
Fri 31 October 2025 |
123.54 (0%) |
106.91 |
106.12 - 123.93 |
0.8834 times |
Fri 31 October 2025 |
123.54 (23.4%) |
101.00 |
94.00 - 123.93 |
1.7519 times |
Fri 24 October 2025 |
100.11 (4.87%) |
95.69 |
95.61 - 102.31 |
0.8041 times |
Fri 17 October 2025 |
95.46 (1.7%) |
95.00 |
88.00 - 98.70 |
1.2245 times |
Fri 10 October 2025 |
93.86 (-7.98%) |
102.16 |
91.65 - 102.68 |
0.8283 times |
Fri 03 October 2025 |
102.00 (11.24%) |
92.26 |
90.62 - 103.00 |
1.0833 times |
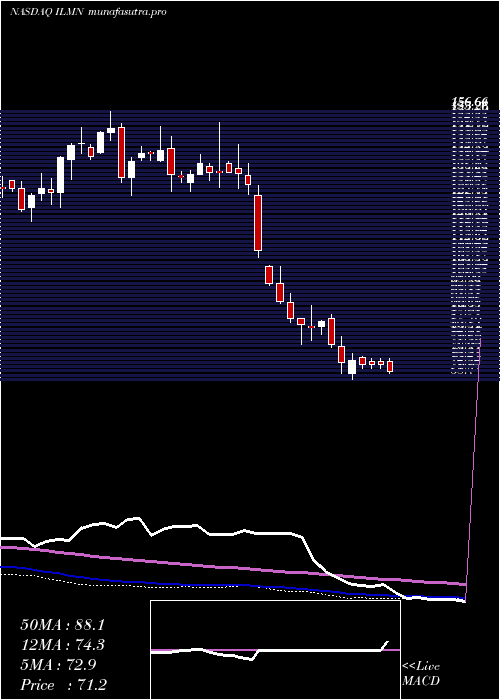
Monthly price and charts IlluminaInc Strong monthly Stock price targets for IlluminaInc ILMN are 122.68 and 130.56 | Monthly Target 1 | 120.58 | | Monthly Target 2 | 124.77 | | Monthly Target 3 | 128.46 | | Monthly Target 4 | 132.65 | | Monthly Target 5 | 136.34 |
Monthly price and volumes Illumina Inc
| Date |
Closing |
Open |
Range |
Volume |
Fri 05 December 2025 |
128.96 (-1.89%) |
129.88 |
124.27 - 132.15 |
0.1476 times |
Fri 28 November 2025 |
131.45 (6.4%) |
117.90 |
116.21 - 131.48 |
0.7624 times |
Fri 31 October 2025 |
123.54 (30.08%) |
94.97 |
88.00 - 123.93 |
1.2335 times |
Tue 30 September 2025 |
94.97 (-4.99%) |
98.69 |
90.62 - 104.22 |
0.8559 times |
Fri 29 August 2025 |
99.96 (-2.68%) |
92.61 |
92.19 - 103.65 |
0.9001 times |
Thu 31 July 2025 |
102.71 (7.65%) |
95.00 |
92.25 - 111.00 |
1.3132 times |
Mon 30 June 2025 |
95.41 (16.01%) |
81.68 |
78.79 - 96.83 |
1.1401 times |
Fri 30 May 2025 |
82.24 (5.98%) |
77.90 |
73.86 - 85.90 |
1.2958 times |
Wed 30 April 2025 |
77.60 (-2.19%) |
79.50 |
68.70 - 82.76 |
1.1883 times |
Mon 31 March 2025 |
79.34 (-10.59%) |
88.70 |
77.54 - 92.90 |
1.163 times |
Fri 28 February 2025 |
88.74 (-33.15%) |
129.18 |
87.50 - 132.41 |
1.8037 times |

DMA SMA EMA moving averages of Illumina Inc ILMN
DMA (daily moving average) of Illumina Inc ILMN
| DMA period | DMA value | | 5 day DMA | 128.24 | | 12 day DMA | 126.77 | | 20 day DMA | 124.61 | | 35 day DMA | 116.66 | | 50 day DMA | 110.52 | | 100 day DMA | 105.11 | | 150 day DMA | 99.2 | | 200 day DMA | 94.72 | EMA (exponential moving average) of Illumina Inc ILMN
| EMA period | EMA current | EMA prev | EMA prev2 | | 5 day EMA | 128.36 | 128.06 | 128.08 | | 12 day EMA | 126.62 | 126.2 | 125.87 | | 20 day EMA | 123.72 | 123.17 | 122.66 | | 35 day EMA | 117.69 | 117.03 | 116.38 | | 50 day EMA | 111.25 | 110.53 | 109.82 |
SMA (simple moving average) of Illumina Inc ILMN
| SMA period | SMA current | SMA prev | SMA prev2 | | 5 day SMA | 128.24 | 128.74 | 129.1 | | 12 day SMA | 126.77 | 126.19 | 125.53 | | 20 day SMA | 124.61 | 124.21 | 123.93 | | 35 day SMA | 116.66 | 115.71 | 114.71 | | 50 day SMA | 110.52 | 109.78 | 109.11 | | 100 day SMA | 105.11 | 104.79 | 104.48 | | 150 day SMA | 99.2 | 98.85 | 98.52 | | 200 day SMA | 94.72 | 94.59 | 94.45 |
|
|
